As the calendar progresses towards the year-end holidays, U.S. equity investors have much to rejoice in. For the second consecutive year, the S&P 500® Index has appreciated by more than 20%, a pattern that hasn’t occurred since the 1995-1999 golden era. At the end of November, MSCI reported U.S. equities accounted for more than two-thirds of the weight of the MSCI All Country World® Index, up from 59% at the end of 2022 – indicating substantial outperformance relative to other regions. Through early December, it has been a much better year for equities than experts predicted 12 months ago.

Note: Wall Street firms included in the estimates are Bank of America, Barclays, BMO, Deutsche Bank, Goldman Sachs, JP Morgan, Morgan Stanley and UBS. Data as of 12/06/2024.
Source: FactSet® and Bloomberg
The challenge of market predictions
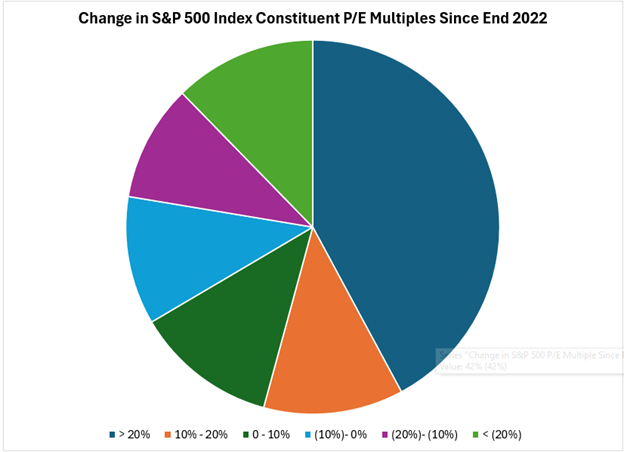
For the fifth consecutive year, a range of Wall Street strategists’ forecasts for year-end S&P 500 Index levels did not bracket the outcome. If the year ended on December 6, the average beginning-of-year forecast fell 22% below the actual result, while even the highest forecast was 16% too conservative. This observation is not intended to shame our well-intentioned industry brethren; it does however once again demonstrate the great difficulties in predicting a point estimate for market returns for a given year. For what it’s worth, these same strategists have established a range for year-end 2025 that would equate to a 7-15% increase (the average is 9%) for the S&P 500 Index from current levels. Based on current consensus expectations of 15% earnings per share (EPS) growth for the S&P 500 Index in 2025, these forecasts assume some minor forward P/E multiple contraction from the 22.4x level of December 6. Relative to history, current valuation is elevated, with the market multiple having expanded from 16.7x at the end of 2022. It’s important to note that this multiple expansion is not simply a reflection of the Magnificent Seven’s growing popularity over the past two years; two-thirds of S&P 500 Index constituents have seen multiple uplift over this timeframe, with more than 40% currently trading at multiples at least 20% above year-end 2022 levels. In total the median P/E multiple expansion of all S&P 500 Index companies since end of 2022 has been 13% per FactSet data.

Source: FactSet as of 12/06/2024.
It’s not just about the Magnificent Seven
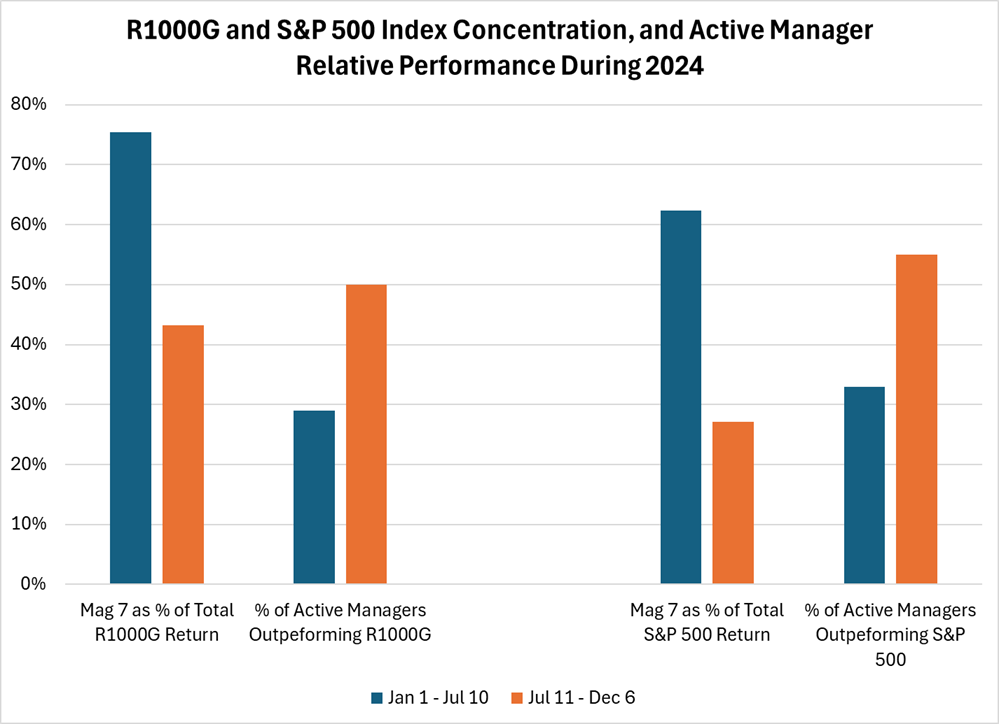
2024 can be split into two distinct periods – both from a market leadership standpoint as well as for active managers in the large growth and core arenas. From the start of the year through July 10, the majority of Russell 1000 Growth® Index and S&P 500 Index returns came from the Magnificent Seven. According to FactSet, these mega-cap technology-oriented stocks contributed more than three-quarters of the Russell 1000 Growth Index return year-to-date through July 10, and more than 60% of the S&P 500 Index return. During this same timeframe, fewer than one in three active managers who compete with these indices outperformed. On the morning of July 11, the June Consumer Price Index (CPI) report was released, showing a month-over-month decline in prices for the first time in four years, increasing confidence that the U.S. central bank would initiate a rate-cutting cycle. Since then, the market has demonstrated greater breadth, while more active U.S. large cap managers have beaten their targeted benchmarks. For instance, our Large-Cap Growth strategy has outperformed the Russell 1000 Growth Index by more than 300 net basis points (bps) while the Flexible Equity strategy has beaten the S&P 500 Index by roughly 200 net bps during this period. While U.S. equity markets during the second half of 2024 are not exhibiting truly broad market leadership, there has been greater balance across sectors while technology sector performance has lagged the market.

Source: FactSet and Morningstar
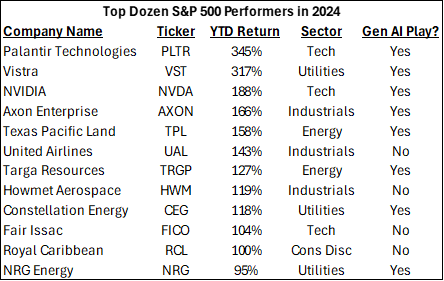
While the Magnificent Seven are often considered a proxy for Generative AI stock performance, they do not come close to speaking for that entire theme, especially when considering 2024 stock returns. Only one of the top dozen performers in the S&P 500 Index this year is among the Magnificent Seven (NVDA), and only three reside in the technology sector, yet I would posit that two-thirds of them are in fact Generative AI “plays”. Earlier this year we discussed how independent power producers such as Vistra, Constellation and NRG Energy are beneficiaries of the rise in power demand associated with the data center buildout. However, other non-traditional Gen AI investments exist as well. Texas Pacific Land owns vast acreage across the Permian Basin, home to very low-cost natural gas production and could become prime real estate for data center development. Targa Resources is a natural gas midstream company with gathering and processing assets, the majority of which are in the Permian Basin. Perhaps the most fascinating story is Axon Enterprise, known for its TASER devices utilized by law enforcement agencies, which now leverages Gen AI to create police reports based on information from its body cameras. These incident summaries save considerable officer time, and importantly are monetizable, significantly accelerating the company’s top line growth rate. Finally, while not true “plays” on Gen AI, companies like United Airlines and Royal Caribbean have incorporated AI into their business practices (operations and pricing strategies, respectively). Thus, while the world watches and waits to see if hyperscalers like Amazon, Microsoft and Alphabet are eventually able to earn an impressive return on investment associated with this technological advancement, there are companies beyond the mega-cap technology universe that carry a high probability to fundamentally benefit from it.

Source: FactSet as of 12/06/2024.
The impact of ‘one-liners’
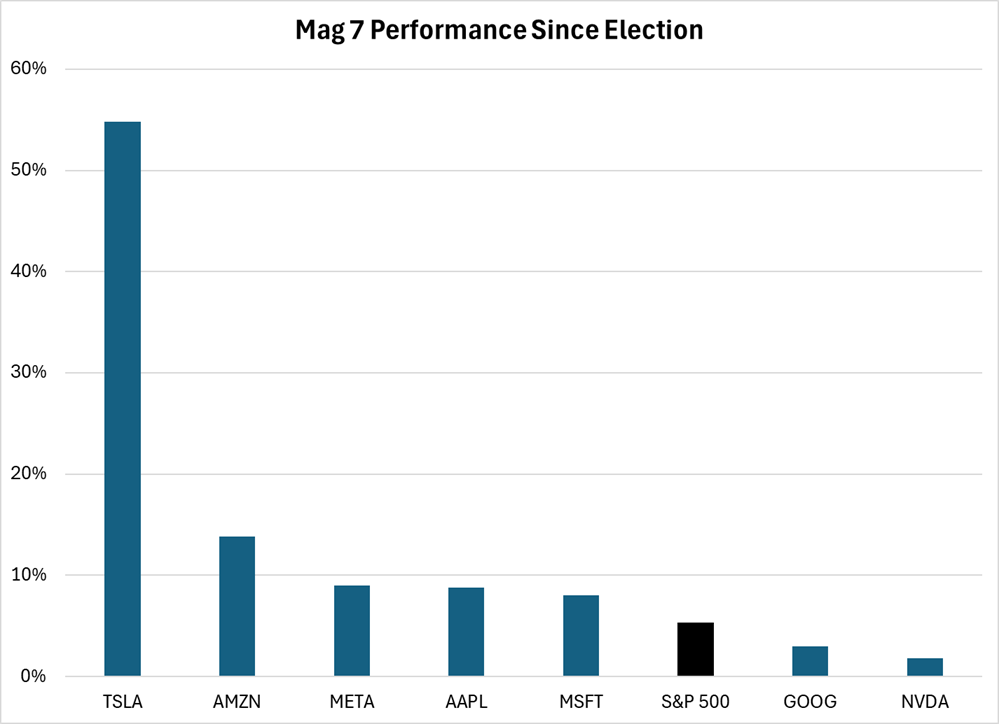
The equity market’s first-month response to the presidential election outcome has generally been favorable, with both the Russell 1000® Index and the Russell 2000® Index up 6-7%, and only the healthcare and materials sectors in decline (both by 2%). Outside of Tesla’s (TSLA) 55% climb over this period, the most interesting (and exhausting) impact on stocks has been the daily volatility of securities based on one-liners from the incoming administration. Comments about tariffs on Mexico, Dogecoin (DOGE) price negotiations and even thoughts on weight loss drugs have rattled investors’ perspectives on individual stocks and even entire subsectors on an almost daily basis since the election. While there has been a great deal of rhetoric around these topics and more, the president-elect has yet to take office, and the impact of potential policies on the future cash flow generation of individual companies is highly challenging to predict. Short-term volatility can create opportunity and is likely the only thoughtful approach a long-term investor can utilize in relation to election-inspired price action today.
Tesla’s Stock Price is Up 55% Since the Election. Has Its Intrinsic Value Increased That Much?

Note: Performance is through 12/06/2024.
Source: FactSet
A cloudy crystal ball
Lastly, what have we learned this year that we can apply to our investment thinking in 2025 and beyond? Coming full circle on the first topic, it’s extraordinarily difficult to get the macro right. A few months ago, it looked highly likely (at least to me) that we were at the precipice of a significant rate cutting cycle. Today, my crystal ball on this front is increasingly cloudy, especially in light of the new administration’s potential policies and their ensuing impact on inflation. Additionally, who would have predicted the sudden toppling of the Assad regime in Syria after 14 years of civil war – and does anyone have the foresight to predict what comes next there?
Yet, as security analysts it’s vital to keep tabs on secular changes that have a direct impact on the quality of the underlying businesses in which we invest. We frequently talk about ‘quality’ as a key component of our investment philosophy, yet it is not an evergreen term when applied to a particular business. Changes in technology, consumer preferences and broad organizational behavior are “macro factors” to consider that can help a quality business move from good to great, or vice versa. The combination of a having a healthy humility regarding what’s unpredictable, keeping a keen eye on secular trends that can meaningfully influence individual security intrinsic value and maintaining a close mapping of company fundamentals is a balanced approach to aspire towards as we turn the page to 2025.
Happy holidays! And remember to never skip a Beat – Eric
Magnificent Seven stocks: Alphabet, Amazon, Apple, Meta, Microsoft, Nvidia, and Tesla.
Source: FactSet®. FactSet is a registered trademark of FactSet Research Systems, Inc
Company information is sourced from each company’s earnings call.
The views expressed are those of the author and Brown Advisory as of the date referenced and are subject to change at any time based on market or other conditions. These views are not intended to be and should not be relied upon as investment advice and are not intended to be a forecast of future events or a guarantee of future results. Past performance is not a guarantee of future performance and you may not get back the amount invested. The information provided in this material is not intended to be and should not be considered to be a recommendation or suggestion to engage in or refrain from a particular course of action or to make or hold a particular investment or pursue a particular investment strategy, including whether or not to buy, sell, or hold any of the securities mentioned. It should not be assumed that investments in such securities have been or will be profitable. To the extent specific securities are mentioned, they have been selected by the author on an objective basis to illustrate views expressed in the commentary and do not represent all of the securities purchased, sold or recommended for advisory clients. The information contained herein has been prepared from sources believed reliable but is not guaranteed by us as to its timeliness or accuracy, and is not a complete summary or statement of all available data. This piece is intended solely for our clients and prospective clients, is for informational purposes only, and is not individually tailored for or directed to any particular client or prospective client.
The views expressed are solely for informational purposes and do not represent an endorsement of any political party or candidate.
Sectors are based on the Global Industry Classification Standard (GICS) sector classification system. The Global Industry Classification Standard (GICS) was developed by and is the exclusive property of MSCI and Standard & Poor’s. “Global Industry Classification Standard (GICS), “GICS” and “GICS Direct” are service marks of Standard & Poor’s and MSCI. “GICS” is a trademark of MSCI and Standard & Poor’s.
The S&P 500® Index represents the large-cap segment of the U.S. equity markets and consists of approximately 500 leading companies in leading industries of the U.S. economy. Criteria evaluated include market capitalization, financial viability, liquidity, public float, sector representation and corporate structure. An index constituent must also be considered a U.S. company. These trademarks have been licensed to S&P Dow Jones Indices LLC. S&P, Dow Jones Indices LLC, Dow Jones, S&P and their respective affiliates (collectively "S&P Dow Jones Indices") do not sponsor, endorse, sell, or promote any investment fund or other investment vehicle that is offered by third parties and that seeks to provide an investment return based on the performance of any index. This document does not constitute an offer of services in jurisdictions where S&P Dow Jones Indices does not have the necessary licenses. S&P Dow Jones Indices receives compensation in connection with licensing its indices to third parties.
MSCI All Country World® Index the MSCI ACWI (All Country World Index), MSCI’s flagship global equity index, is designed to represent performance of the full opportunity set of large- and mid-cap stocks across developed and emerging markets. As of May 2022, it covers more than 2,933 constituents across 11 sectors and approximately 85% of the free float-adjusted market capitalization in each market. All MSCI indexes and products are trademarks and service marks of MSCI or its subsidiaries.
The Russell 1000® Index represents the top 1000 companies by market capitalization in the United States. The index is a subset of the Russell 3000 Index. The Russell 2000® Index measures the performance of the small-cap segment of the U.S. equity universe.
The Russell 1000® Growth Index measures the performance of the large-cap growth segment of the U.S. equity universe. It includes those Russell 1000® Index companies with higher price-to-book ratios and higher forecasted growth values. The Russell 1000® Growth Index is constructed to provide a comprehensive and unbiased barometer for the large-cap growth segment. The Index is completely reconstituted annually to ensure that new and growing equities are included and that the represented companies continue to reflect growth characteristics.
The Russell 2000® Index measures the performance of the small-cap value segment of the U.S. equity universe. It includes those Russell 2000® Index companies with lower price-to-book ratios and lower forecasted growth values. The Russell 2000® Value Index is constructed to provide a comprehensive and unbiased barometer for the small-cap value segment. The Index is completely reconstituted annually to ensure new and growing equities are included and that the represented companies continue to reflect value characteristics.
Frank Russell Company (“Russell”) is the source and owner of the trademarks, service marks and copyrights related to the Russell Indexes. Russell® is a trademark of Frank Russell Company. Neither Russell nor its licensors accept any liability for any errors or omissions in the Russell Indexes and / or Russell ratings or underlying data and no party may rely on any Russell Indexes and / or Russell ratings and / or underlying data contained in this communication. No further distribution of Russell Data is permitted without Russell’s express written consent. Russell does not promote, sponsor or endorse the content of this communication.
An investor cannot invest directly into an index.
Consumer Price Index (CPI) measures the monthly change in prices paid by U.S. consumers.
Earnings per share (EPS) is calculated as a company's profit divided by the outstanding shares of its common stock.
P/E Ratio compares a company’s share price with its earnings per share. Often called the price or earnings multiple, the P/E ratio helps assess the relative value of a company’s stock.
