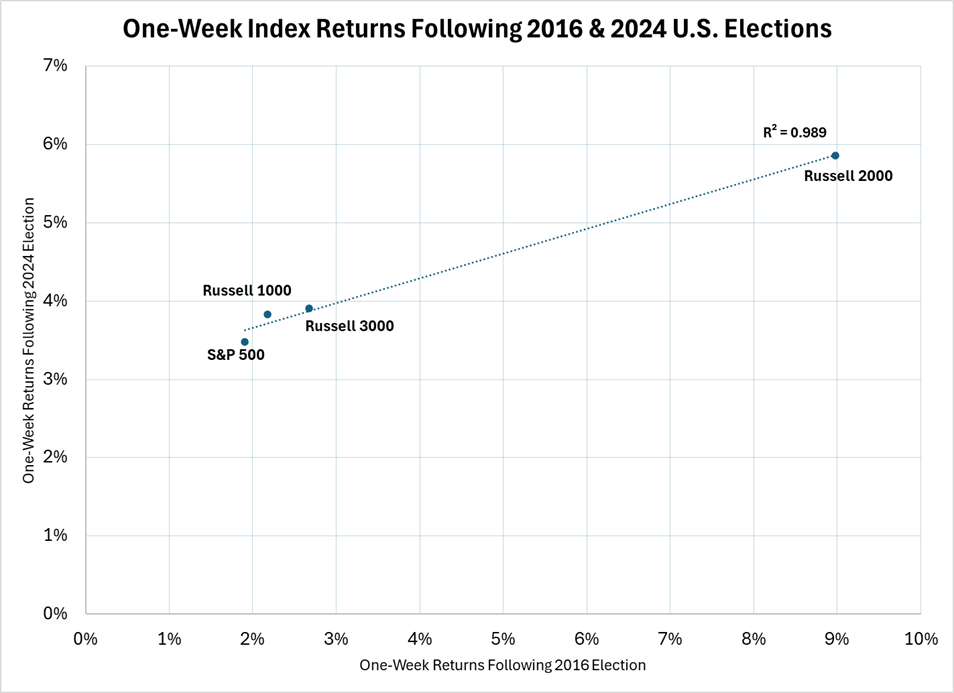
Mark Twain, author of Adventures of Huckleberry Finn is credited with the quote, “History doesn’t repeat itself, but it does rhyme.” Well, equity market observers might disagree with the father of American literature. Market returns in the week following the 2024 U.S. election appear almost identical to that of the period immediately after the conclusion of the 2016 race. In both instances, Donald J. Trump was elected president of the United States, with the Republican party holding/projected to hold the majority in both chambers of Congress.

Source: FactSet®. Data from 11/8/2016 to11/15/2016 and 11/5/2024 to 11/12/2024.
This initial reaction is sensible to me, as the president-elect’s campaign has covered many of the same priorities as eight years ago – lower taxes, reduced regulation, stricter immigration policies and more aggressive tariffs. Just as in 2016 we’ve seen small caps, which tend to be more domestic in footprint, outperform large caps which often carry greater exposure to international regions. In addition, pro-cyclical sectors, such as financials and consumer discretionary, are leading the market and are outperforming secular growth sectors like technology and communication services.
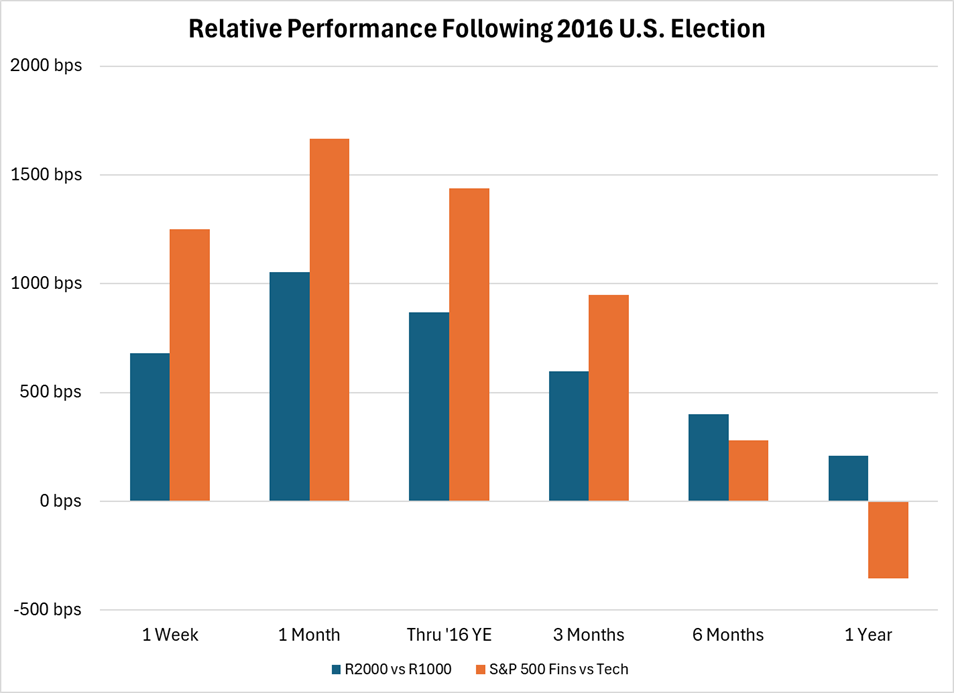
The question on all U.S. equity investors’ minds is whether these trends will continue for the foreseeable future. Contrary to popular belief, the 2016 “Trump Trade” did not last for very long. The outperformance of financials and small caps relative to technology and large caps, respectively, peaked after the first month, after which the gap closed. Within 12 months of the election, large caps nearly caught up, while tech overtook financials and didn’t look back.

Note: Data is from 11/8/2016 to 11/8/2017. Sectors included are the Financial Select Sector SPDR® Fund (XLF) and the Technology Select Sector SPDR® Fund (XLK) for the S&P 500 Index.
Source: FactSet.
So, what’s different this time around? First off, this is no longer the president-elect’s first rodeo in Washington. Perhaps he’ll be able to enact agenda policies more quickly and definitively, which could extend the “Trump Trade” momentum for longer. At the same time, most economists believe that the eventual consequence of these policies would be rising inflation, leading to a possible showdown between the Federal Reserve Chairman and the president-elect. Rising rates would likely challenge the pro-cyclical tilt of the market as they would act as a headwind to economic growth.
In addition, the backdrop for stock valuations, earnings growth expectations and Treasury yields are considerably different than eight years ago. Today, the S&P 500® Index forward P/E multiple resides at 22.3x, versus the 30-year average of 16.7x. The market multiple peaked at 24.3x in early 2000 just before the dot-com bubble burst. Also, when Trump was elected to his first term, the market multiple was only 16.3x. Similarly, expectations for corporate earnings growth are higher today than late 2016. At that time, consensus estimates called for 2017 S&P 500 Index earnings per share (EPS) growth of 11-12%. Today, consensus is estimating roughly 15% EPS growth for 2025. Finally, when Trump was elected in 2016, the 10-year Treasury yield was 1.85%, compared to a yield approaching 4.5% today. Typically, a higher yield on the 10-year corresponds to a lower P/E multiple for stocks. Thus, the set-up today doesn’t inspire confidence that the 21% S&P 500 Index return experienced in the year following the 2016 election will repeat itself.
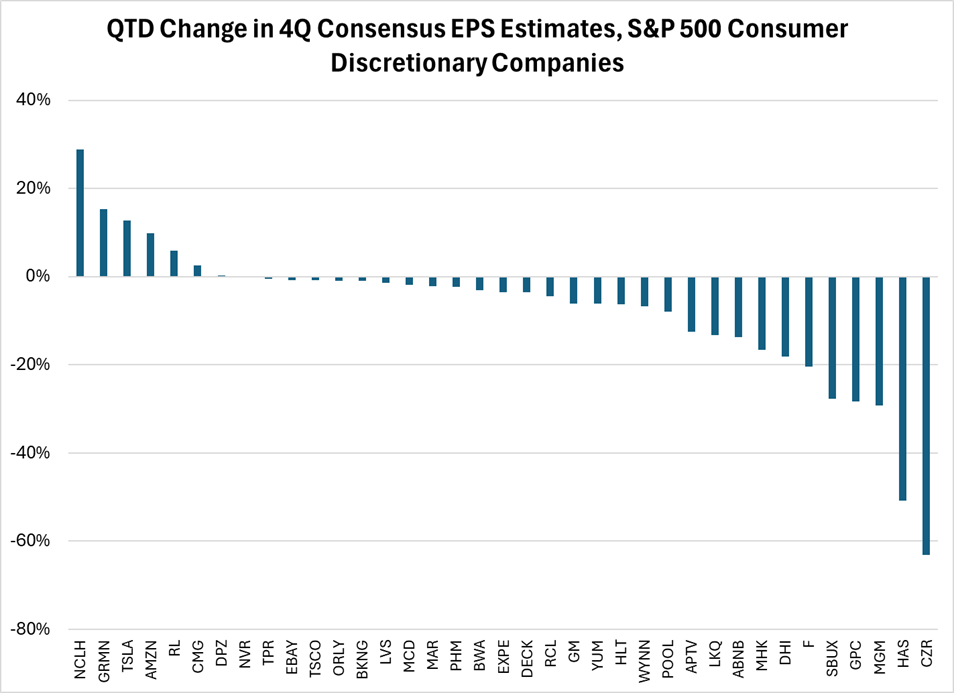
Layered on top of these caution signals are anecdotal comments from companies during the most recent earnings season, sprinkling some doubt on the well-worn narrative of a ‘resilient’ U.S. consumer. Sherwin-Williams mentioned that its Auto Refinish segment was under pressure due to repairable auto insurance claims declining roughly 10% in the third quarter. That’s a lot of people choosing to drive damaged vehicles rather than pay insurance deductibles. A.O. Smith’s North American water heater business saw volumes decline by more than 4% in the third quarter. It’s hard to imagine consumers deferring the purchase of a working water heater for their home. Lastly, Idexx Labs stated that U.S. veterinary ‘wellness’ visits fell 3-4% in the third quarter from a year ago. That’s akin to people deferring their annual physical exams (although unlike for humans, vet wellness visits often aren’t covered by insurance). Overall, consumer discretionary companies in the S&P 500 Index that have reported September-quarter results have seen an average decline in their fourth quarter (December quarter) consensus EPS estimates of 7.5% since the end of September. Elevated borrowing rates combined with uncertainty surrounding the election have been the most common corporate explanations for these negative earnings estimate revisions. In the coming months, we’ll learn whether the definitive election outcome removes a sizeable source of uncertainty for consumers, improving sentiment and accelerating spending.

Note: Data as of 11/12/2024. Companies included are consumer discretionary constituents of the S&P 500 Index that have reported third quarter results.
Source: FactSet
Let’s bookend this analysis with two other legendary quotes – the first from Mike Tyson (not quite as eloquent as Mark Twain, but just as memorable). “Everyone has a plan until they get punched in the mouth.” Over the course of the 21st century, every American president has encountered an exogenous event that has forced a shift in priorities. “W” had 9/11. Obama had the great financial crisis. Both Trump and Biden dealt with the global pandemic. While we cannot predict the next black swan event nor its likelihood of occurring during the next administration, it is worth remembering former U.S. Defense Secretary Donald Rumsfeld’s famous statement, “There are unknown unknowns…and if one looks throughout the history of our country…(they) tend to be the difficult ones.”
In conclusion, the 2016 “Trump Trade” peaked after the first month and was followed by a full year of relative performance mean reversion. The president-elect’s priorities and potential policy actions – which appear at first glance inflationary – could be forced to shift at a moment’s notice due to the “unknown unknowns”. The market backdrop is very different than it was at the beginning of Trump’s first term, and while the consumer remains ‘resilient’ overall, there are clear cracks in behavior patterns – perhaps due to transitory election uncertainty that has now been removed, although more likely due to borrowing rates that remain high relative to recent history. Perhaps Twain, Tyson and Rumsfeld can all contribute to the investment playbook for Trump 2.0. As equity investors we should be aware of the to-date similarities in the market’s response to the president-elect’s two victories, while acknowledging the distinct differences of the market backdrop this time around and recognizing that every playbook needs revision as we obtain new information.
Thanks for reading, and remember to never skip a Beat – Eric
Stocks: Norwegian Cruise Line Holdings Ltd (NCLH), Garmin (GRMN), Tesla Inc (TSLA), Amazon.com Inc (AMZN), Ralph Lauren Corp (RL), Chipotle Mexican Grill Inc (CMG), Domino’s Pizza Inc (DPZ), NVR Inc (NVR), Tapestry Inc (TPR), eBay Inc (EBAY), Tractor Supply Co (TSCO), O’Reilly Automotive Inc (ORLY), Booking Holdings Inc (BKNG), Las Vegas Sands Corp (LVS), McDonald’s Corp (MCD), Marriott International Inc (MAR), PulteGroup Inc (PHM), BorgWarner Inc (BWA), Expedia Group Inc (EXPE), Deckers Outdoor Corp (DECK), Royal Caribbean Cruises Ltd (RCL), General Motors (GM), Yum! Brands Inc (YUM), Hilton Hotels Corporation Common Stock (HLT), Wynn Resorts Limited (WYNN), Pool Corp (POOL), Aptiv PLC (APTV), LKQ Corp (LKQ), Airbnb Inc (ABNB), Mohawk Industries Inc (MHK), DR Horton Inc (DHI), Ford Motor Co (F), Starbucks Corp (SBUX), Genuine Parts Co (GPC), MGM Resorts International (MGM), Hasbro Inc (HAS), Caesars Entertainment Inc (CZR) Source: Factset®. FactSet is a registered trademark of FactSet Research Systems, Inc
Retailer stocks: Bath & Body Works Inc (BBWI), Best Buy Co Inc (BBY)Dollar General (DG), Dollar Tree (DLTR), Five Below (FIVE), Home Depot (HD), Lowes (LOW), Lululemon Athletica Inc (LULU), Ross Stores (ROST), Target (TGT), TJX Companies (TJX), Ulta (ULTA), and Walmart (WMT).
Company information is sourced from each company’s earnings call.
The views expressed are those of the author and Brown Advisory as of the date referenced and are subject to change at any time based on market or other conditions. These views are not intended to be and should not be relied upon as investment advice and are not intended to be a forecast of future events or a guarantee of future results. Past performance is not a guarantee of future performance and you may not get back the amount invested. The information provided in this material is not intended to be and should not be considered to be a recommendation or suggestion to engage in or refrain from a particular course of action or to make or hold a particular investment or pursue a particular investment strategy, including whether or not to buy, sell, or hold any of the securities mentioned. It should not be assumed that investments in such securities have been or will be profitable. To the extent specific securities are mentioned, they have been selected by the author on an objective basis to illustrate views expressed in the commentary and do not represent all of the securities purchased, sold or recommended for advisory clients. The information contained herein has been prepared from sources believed reliable but is not guaranteed by us as to its timeliness or accuracy, and is not a complete summary or statement of all available data. This piece is intended solely for our clients and prospective clients, is for informational purposes only, and is not individually tailored for or directed to any particular client or prospective client.
The views expressed are solely for informational purposes and do not represent an endorsement of any political party or candidate.
Sectors are based on the Global Industry Classification Standard (GICS) sector classification system. The Global Industry Classification Standard (GICS) was developed by and is the exclusive property of MSCI and Standard & Poor’s. “Global Industry Classification Standard (GICS), “GICS” and “GICS Direct” are service marks of Standard & Poor’s and MSCI. “GICS” is a trademark of MSCI and Standard & Poor’s.
The S&P 500® Index represents the large-cap segment of the U.S. equity markets and consists of approximately 500 leading companies in leading industries of the U.S. economy. Criteria evaluated include market capitalization, financial viability, liquidity, public float, sector representation and corporate structure. An index constituent must also be considered a U.S. company. These trademarks have been licensed to S&P Dow Jones Indices LLC. S&P, Dow Jones Indices LLC, Dow Jones, S&P and their respective affiliates (collectively "S&P Dow Jones Indices") do not sponsor, endorse, sell, or promote any investment fund or other investment vehicle that is offered by third parties and that seeks to provide an investment return based on the performance of any index. This document does not constitute an offer of services in jurisdictions where S&P Dow Jones Indices does not have the necessary licenses. S&P Dow Jones Indices receives compensation in connection with licensing its indices to third parties.
The Russell 1000® Index represents the top 1000 companies by market capitalization in the United States. The index is a subset of the Russell 3000 Index. The Russell 2000® Index measures the performance of the small-cap segment of the U.S. equity universe.
The Russell 2000® Value Index measures the performance of the small-cap value segment of the U.S. equity universe. It includes those Russell 2000® Index companies with lower price-to-book ratios and lower forecasted growth values. The Russell 2000® Value Index is constructed to provide a comprehensive and unbiased barometer for the small-cap value segment. The Index is completely reconstituted annually to ensure new and growing equities are included and that the represented companies continue to reflect value characteristics.
The Russell 3000® Index is a market capitalization weighted equity index maintained by the FTSE Russell that provides exposure to the entire U.S. stock market. The index tracks the performance of the 3,000 largest U.S.-traded stocks which represent about 98% of all U.S incorporated equity securities.
Frank Russell Company (“Russell”) is the source and owner of the trademarks, service marks and copyrights related to the Russell Indexes. Russell® is a trademark of Frank Russell Company. Neither Russell nor its licensors accept any liability for any errors or omissions in the Russell Indexes and / or Russell ratings or underlying data and no party may rely on any Russell Indexes and / or Russell ratings and / or underlying data contained in this communication. No further distribution of Russell Data is permitted without Russell’s express written consent. Russell does not promote, sponsor or endorse the content of this communication.
An investor cannot invest directly into an index.
The Financial Select Sector SPDR® Fund is an exchange-traded fund that seeks to provide investment results that, before expenses, correspond generally to the price and yield performance of the Financial Select Sector Index (the “Index”). The Index seeks to provide an effective representation of the financial sector of the S&P 500 Index.
The Technology Select Sector SPDR® Fund is an exchange-traded fund that seeks to provide investment results that, before expenses, correspond generally to the price and yield performance of the Technology Select Sector Index (the “Index”). The Index seeks to provide an effective representation of the technology sector of the S&P 500 Index.
Forward P/E Ratio is determined by dividing the price of the stock by the company's forecasted earnings per share.
Earnings per share (EPS) is calculated as a company's profit divided by the outstanding shares of its common stock.
P/E Ratio compares a company’s share price with its earnings per share. Often called the price or earnings multiple, the P/E ratio helps assess the relative value of a company’s stock.
