
You may have heard the riddle that goes: ‘Which weighs more, a pound of feathers or a pound of lead?’ Despite their differences in density, a pound is a measure of mass, thus one pound of feathers is in fact equivalent in weight to one pound of lead. Don’t be fooled by perception.
That riddle is typically followed by another: ‘Which weighs more, a pound of feathers or a pound of gold?’ Already conditioned to respond “neither” from the prior riddle, most people don’t realize this is a trick question. While feathers, and just about everything else are measured using the standard Avordupois system where 16 ounces are in a pound, gold – along with other precious metals and gems – is measured in “Troy” pounds, which contain only 12 ounces. Thus, technically speaking, one pound of feathers does weight more than one pound of gold.
If you were stumped by this riddle, don’t feel bad. So was Microsoft Copilot!

Source: copilot.microsoft.com
The irony here is “heavy”, as investors appear to be applying a different weighing mechanism to Generative AI (Gen AI) related stocks than most others since the ChatGPT Era began (roughly the end of 2022). While I do not intend to tackle the controversial question of whether this group of stocks is overvalued today, the data presented in this month’s Equity Beat suggest that fundamentals likely do not explain the entirety of their outperformance. Instead, the market leadership provided by this narrow band of stocks over the past 18 months appears driven by a combination of emotion and reason. It is our task to determine the percentage mix of these factors on an individual security basis.
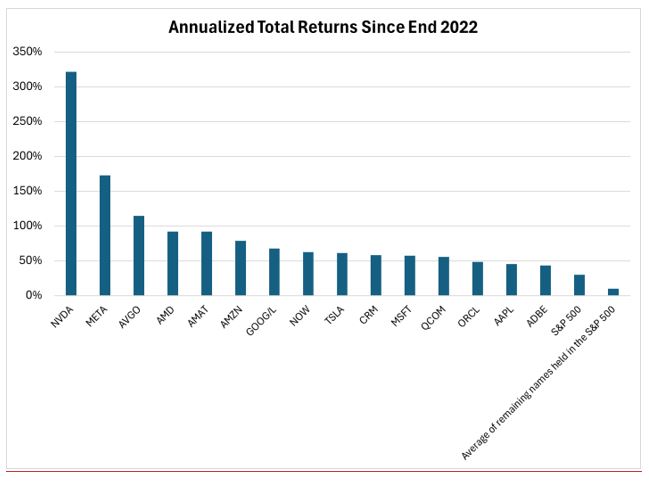
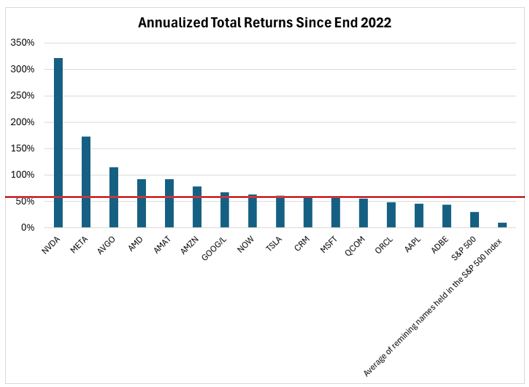
Note: Data is through 7/5/2024. Please see the end for important disclosures including full Large-Cap Gen AI names.
Source: FactSet
The Magnificent Seven1 have accounted for most of the market’s very strong returns during the ChatGPT Era. Broadening the list out just slightly demonstrates that just 15 Generative AI Large Cap stocks are responsible for more than three-quarters of the S&P 500® Index’s return since the end of 2022. Cumulatively, these 15 names have carried an average weight of 31.5% in the S&P 500 Index over this timeframe. As a portfolio manager, if you’ve been overweight these stocks, you’ve very likely outperformed the Index, as every single one has outperformed the S&P 500 Index since the end of 2022. Conversely, the average performance of all other stocks in the Index has substantially underperformed the S&P 500 Index over this time.
Source: FactSet as of 7/5/2024. Please see the end for important disclosures and a complete list of terms and definitions.
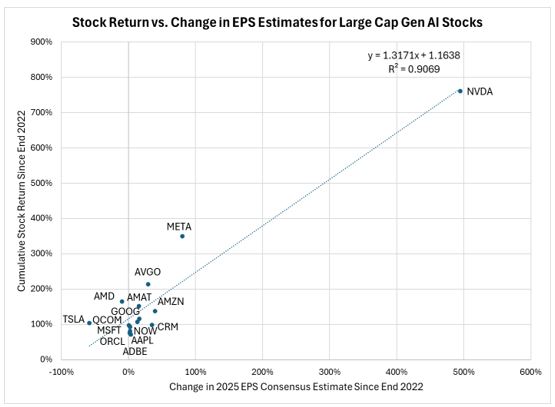
What’s driven the outperformance of this narrow group? Let’s look at changes to consensus earnings estimates for calendar year 2025 as a proxy for changes to fundamentals. The chart above compares cumulative stock returns and the percent change to 2025 earnings per share (EPS) consensus estimates since the start of the ChatGPT Era for the group of Generative AI Large Cap stocks. For this set of companies, there is a strong correlation between cumulative stock returns and changes in EPS estimates.
Traveling way back to high school algebra, I would highlight the two numbers in the regression equation presented on the chart. “1.1638” is the intercept – the point at which the regression line crosses zero on the x-axis. It suggests that for this set of companies, a zero percent change in expectations for 2025 EPS estimates has generally rewarded investors with a 116% return over the past 18 months. Advanced Micro Devices, Inc. (AMD) is the most unusual and counter-intuitive example on the chart, where a 9% DECREASE in earnings expectations has been paired with a 165% rise in share price. The second number of relevance is the “1.3171x” – this is the slope of the equation. It suggests that for every 1% increase in 2025 EPS estimates, this group of stocks has climbed an additional 1.317%. That’s of course on top of the 116% return for NO change in consensus estimates.
Source: FactSet as of 7/5/2024.
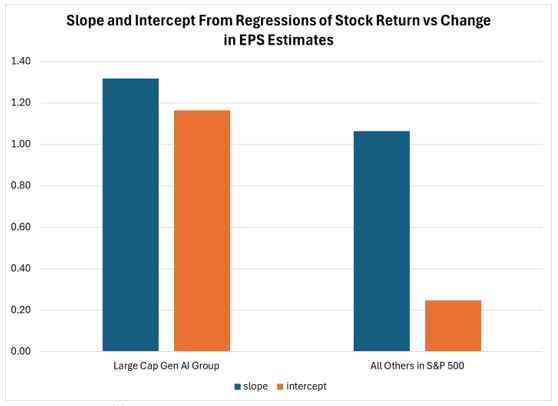
Let’s now compare the same numbers (slope and intercept) for all other members of the S&P 500 for whom 2025 EPS consensus estimates existed at the end of 2022. The starkest difference is the intercept – while a NO change in estimates has been met by a more than doubling of stock price for the Gen AI set of companies, the other group has seen a 25% stock return. In addition, while less pronounced, the slope of the Gen AI line is steeper than that for the “all others” group. This means that any incremental increase in EPS estimates for the Gen AI group has been rewarded more generously by investors than for the “all others” contingent.
Stepping away from algebraic expressions and into real-life examples, let’s look at JP Morgan Chase & Co. (JPM). The stock has returned 60% cumulatively since the end of 2022 – a very healthy return that has outperformed the S&P 500 Index. Analysts have increased their 2025 EPS estimates for JPM by 16% since the end of 2022 as a function of an improved fundamental outlook for the business. Imagine if the stock had incorporated the slope and intercept of the Large Cap Gen AI group? JPM’s return would have been roughly 137%!
The Large Cap Gen AI group has collectively delivered impressive fundamental performance over the past year-and-a-half, with the median company showing a 13% increase in 2025 EPS consensus estimates since the start of the ChatGPT Era. That compares favorably to a 3% median decline in estimates for the “all others” category. Gen AI is a technological advancement that has already generated a tremendous investment cycle. One need look no further than NVDA’s nearly 500% increase in 2025 EPS consensus estimates since the beginning of the ChatGPT Era to appreciate the importance of this innovation. It’s highly reasonable to anticipate positive earnings estimate revisions for at least a portion of this group of companies in the future given the immaturity of the technology today. There is much more for us to learn as individuals, communities, companies and sovereignties. It’s both exciting and anxiety-producing to consider our future with Generative AI coursing through the veins of the collective human experience.
Yet a vast, rapid increase in market capitalization measuring in the trillions of dollars among a small set of very large enterprises despite highly uncertain outcomes associated with eventual Gen-AI monetization is worth a deeper dive. The market’s very different reaction over the past 18 months to incremental changes – or even no change - to business fundamentals among the “haves” and “have nots” is worth taking note. Perhaps a pound of Gen AI stocks does in fact weigh more than a pound of “all others”. Or perhaps, we shouldn’t be fooled by perception.
We believe there are companies across all economic sectors that will impress to the upside on fundamentals and strengthen or maintain their substantial competitive advantages over time. Our task is to discover and invest in the securities of these companies, with an awareness of the market’s weighing mechanisms in use.
Thanks for reading, and remember to never skip a Beat Eric
1Maginficent Seven stocks: Alphabet, Amazon, Apple, Meta, Microsoft, Nvidia, and Tesla.
Large-Cap Gen AI Stocks shown include Advanced Micro Devices, Inc. (AMD), Meta Platforms Inc (META), Broadcom Inc (AVGO), Amazon.com Inc (AMZN), Tesla Inc (TSLA), Qualcomm Inc (QCOM), Oracle Corp (ORCL), Apple Inc (AAPL), Adobe Inc (ADBE), ServiceNow Inc (NOW), Salesforce Inc (CRM), Alphabet Inc (GOOG), NVIDIA Corp (NVDA), Applied Materials (AMAT), Microsoft Corp (MSFT)
The views and opinions expressed in this podcast are those of the speaker(s) and do not necessarily reflect those of Brown Advisory. These views are not intended to be and should not be relied upon as investment advice and are not intended to be a forecast of future events or a guarantee of future results. The information provided in this podcast is not intended to be and should not be considered a recommendation or suggestion to engage in or refrain from a particular course of action or to make or hold a particular investment or pursue a particular investment strategy, including whether or not to buy, sell, or hold any of the securities mentioned. It should not be assumed that investments in such securities have been or will be profitable. To the extent specific securities are mentioned, they have been selected by the author on an objective basis to illustrate views expressed in the commentary and do not represent all of the securities purchased, sold or recommended for advisory clients. The information contained herein has been prepared from sources believed reliable but is not guaranteed by us as to its timeliness or accuracy and is not a complete summary or statement of all available data. This piece is intended solely for our clients and prospective clients, is for informational purposes only, and is not individually tailored for or directed to any particular client or prospective client.
Sectors are based on the Global Industry Classification Standard (GICS) sector classification system. The Global Industry Classification Standard (GICS) was developed by and is the exclusive property of MSCI and Standard & Poor’s. “Global Industry Classification Standard (GICS), “GICS” and “GICS Direct” are service marks of Standard & Poor’s and MSCI. “GICS” is a trademark of MSCI and Standard & Poor’s.
The S&P 500® Index represents the large-cap segment of the U.S. equity markets and consists of approximately 500 leading companies in leading industries of the U.S. economy. Criteria evaluated include market capitalization, financial viability, liquidity, public float, sector representation and corporate structure. An index constituent must also be considered a U.S. company. These trademarks have been licensed to S&P Dow Jones Indices LLC. S&P, Dow Jones Indices LLC, Dow Jones, S&P and their respective affiliates (collectively "S&P Dow Jones Indices") do not sponsor, endorse, sell, or promote any investment fund or other investment vehicle that is offered by third parties and that seeks to provide an investment return based on the performance of any index. This document does not constitute an offer of services in jurisdictions where S&P Dow Jones Indices does not have the necessary licenses. S&P Dow Jones Indices receives compensation in connection with licensing its indices to third parties.
An investor cannot invest directly into an index.
Terms and Definitions:
Earnings per share (EPS) is a company's net income subtracted by preferred dividends and then divided by the number of common shares it has outstanding.
Source: Factset® as of 07/05/2024. FactSet® is a registered trademark of FactSet Research Systems, Inc