Jump to: What we're hearing | The Bridge | What we're seeing | What we're thinking
Download PDF >
Welcome to our latest edition of Hearing, Seeing, Thinking (HST). In today’s note, we take a deep dive into the global banking system. Weak banks are failing, strong banks aren’t lending and the Federal Reserve isn’t blinking. We also share a few thoughts on what that means for our investment thinking. But we begin today with the story behind the second-largest bank failure in U.S. history.

Source: https://www.fdic.gov/resources/resolutions/bank-failures/failed-bank-list/silicon-valley.html
What We're Hearing
In its most simple form, a bank works like this. It takes in liabilities known as demand deposits (i.e. money that can be withdrawn at any time and without notice) and simultaneously creates a portfolio of assets by lending out a majority of those customer deposits in the form of loans. The interest rate paid on the deposits is normally less than the interest received on the loans. The difference between the interest rate received and the interest rate paid is known as the spread. This is how banks generate revenue. The greater the spread, the more revenue a bank earns. The most basic way to think about the difference in interest rates is the cost of time. Interest is a charge for the use of money over a certain period of time. And time has value. The longer a lender extends the use of its capital, the more interest it expects to receive in return, all else, like the ability and willingness to repay, being equal. Put another way, a bird in the hand is worth two in the bush.

This system is known as having an asset-liability mismatch. A bank’s primary asset (i.e. loans) is less liquid (i.e. cannot immediately be converted to cash) than its primary liability (i.e. deposits). Banks hold a small proportion of their assets in the form of cash or cash equivalents. The system generally works quite well as long as the assets are sound and the deposit base remains calm. People may bemoan their banking relationship, but they rarely jump from one service provider to another. The benefits are questionable while the hassle and disruption are undeniable. Rarely, however, does not mean never. If a bank mismanages its assets, its customer base may get spooked. The reason being is this: if the value of its assets falls below what the bank must honour in deposits, customers begin to fear that the institution may run out of money. Remember, banks hold little cash on hand. Furthermore, their loans are relatively illiquid. If they can be sold quickly, it’s typically at a discount, placing further pressure on the asset base. It’s sort of akin to sailing on a ship. Think of the deposits as passengers and the loans as life boats. If there are more passengers than life boats and news spreads that the ship has sprung a leak, common courtesy quickly gives way to primitive instinct. In a bank, the first few customers who catch word of the leak begin to sprint for the exit. Withdrawals pick up. Word spreads and the “run-on-the-bank” scenario ensues. This is essentially what happened to Silicon Valley Bank (SVB) on the 10th of March. New York-based Signature Bank followed suit two days later. The run on both banks unfolded via the same playbook that ushered in prior bank runs, apart for the lack of an epic queue. More on that later.

The U.S. Banking Act of 1933 established the Federal Deposit Insurance Corporation (FDIC). The FDIC insures deposits that a person holds in one insured bank up to $250,000. The idea is simple. A government backstop helps provide confidence and promote stability. If any perceived issues arose, deposit insurance bought a bank time to sort out any short-term issues hanging over its asset base. For most depositors, $250,000 does the trick. However, the vast majority of SVB deposits exceeded the $250,000 limit. In fact, they did so by a wide margin. It’s been reported that the average deposit was around $5 million. At this point we need to say one or two words about the bank’s client base. SVB was built for venture-backed tech start-ups flush with investor cash. This cash was vital to supporting the day-to-day operations associated with building a business. Moreover, tech start-ups tend to burn through cash at a pretty impressive rate. Therefore, anything that threatened access to that liquidity was essentially an existential threat. Even if an SVB customer knew it would eventually be made whole, the cash burn meant they lacked the time to wait for an administrator to sort things out. Ergo, the incentive to abandon ship was certainly there.
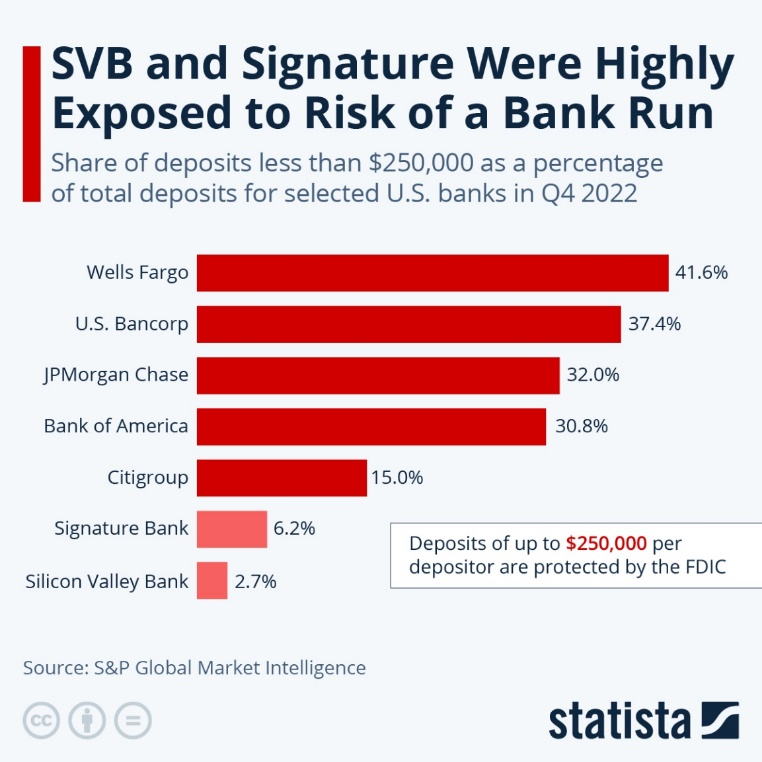
Source: Richter, F. (13 March 2023). SVB and Signature Were Highly Exposed to Risk of a Bank Run [Digital image]. Retrieved 23 March 2023, from https://www.statista.com/chart/29478/share-of-fdic-protected-deposits-at-selected-banks/.
The nature of SVB’s client base also played a role in how the bank invested those deposits. The frenetic pace at which venture-backed firms kept raising capital translated into a mountain of money on SVB’s balance sheet. By the end of 2022, the bank found itself sitting on $173 billion in customer deposits, up 251% from 20181. So, what did they do with the money? Loan demand for entrepreneurs only goes so far. Generally speaking, old-economy commercial borrowers (e.g. Merchant’s Tire & Auto) already have well-established banking relationships. In other words, the growth in SVB’s deposit base outpaced the banks capacity to deploy the capital in the form of loans. Public markets became the natural place to turn. At the end of 2022, SVB’s securities portfolio had ballooned to $117 billion compared to a relatively modest sum of $23 billion just four years prior. We also need to make a quick and crude distinction between the difference in making a loan to an old-economy borrower and buying government-backed bonds. Commercial loans are typically structured as floating-rate debt. If interest rates rise, so does the payment the borrower owes the bank. In this instance, the bank assumes credit risk. Investors who buy fixed-rate Treasuries or bonds issued by government-sponsored enterprises forego any exposure to credit risk. What they assume in its place is interest-rate risk. And here’s where things get interesting.
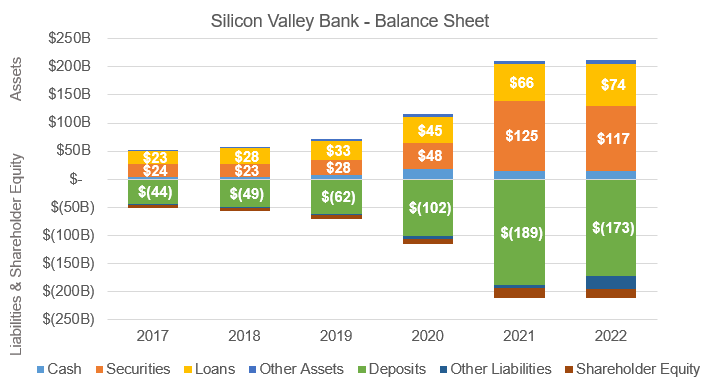
Source: SVB Financial Group, Annual Reports 2017-2022.
Everything went according to plan until interest rates began to rise. By the end of 2021, just three months before the U.S. Federal Reserve began its most aggressive 12-month hiking cycle since 1981, SVB’s balance sheet was chock-full of long-dated fixed-income securities. Roughly 80% of those publicly traded bonds had contractual maturities that were greater than 10 years.2 The bank selected these bonds in a quest for yield during an era of ultra-low interest rates. As the Fed continued to hike, the market value of those securities continued to fall. Recall that bond prices generally move in the opposite direction of interest rates. Most banks are aware of this risk and hedge it out as a result. SVB, however, did not. It’s important to point out that the long-term value (i.e. credit risk) was not impaired. SVB effectively sat on paper losses. Even if interest rates remained high, the market value of the bonds would be pulled to par (i.e. $100) as they approached their maturity date. But that day was years away. As a result, the mark-to-market decline called into question whether deposit holders could access their funds should the demand for cash surge.
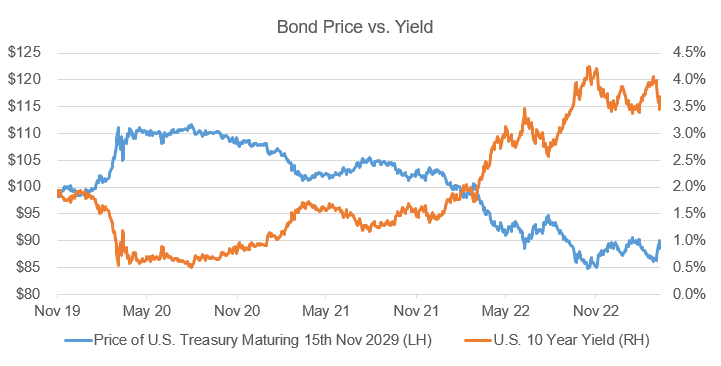
Source: Bloomberg. Data from 6 November 2019 to 16 March 2023.
So what may cause a surge in demand? The answer could be any number of things. In this case, as interest rates continued to rise, venture capital funding began to dry up. Consequently, venture-backed companies began to look at the cash they had on hand to fund existing operations. In some respects, it was a tinderbox sitting next to a stack of matches. Now tech-savvy entrepreneurs may not know much about auditing banks, but they quickly caught on to the risks percolating under the surface at SVB. Whisper campaigns began popping up on social media platforms and private chat groups. By the 10th of March, the dam gave way. To the chagrin of my British colleagues, digital banking eliminated the need for an orderly queue. Customers withdrew an astounding $42 billion in a single day, leaving the bank with a negative cash balance of $1 billion.3 That’s an astonishing turn of events.
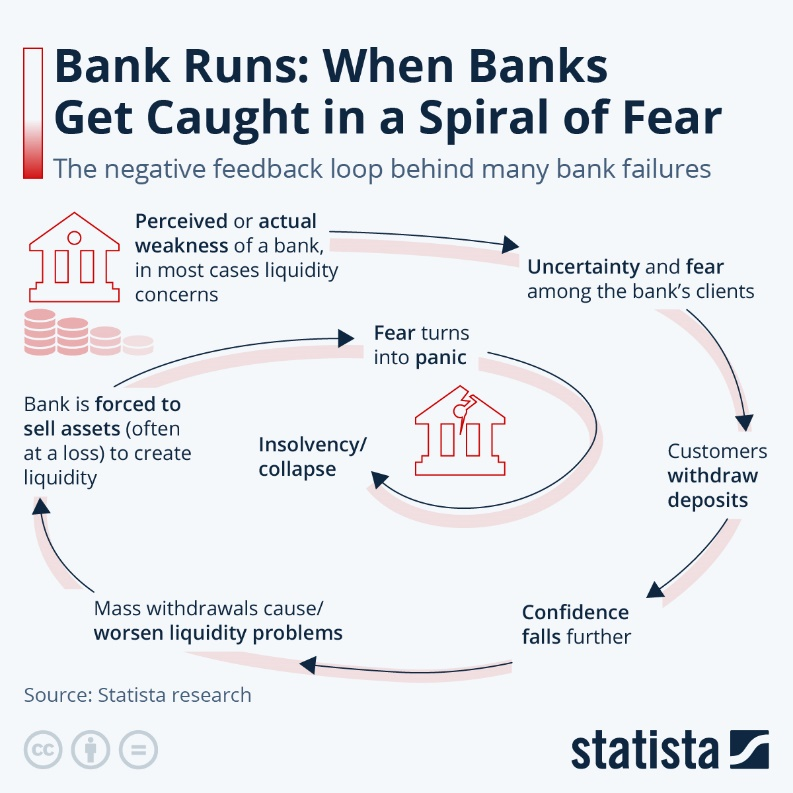
Source: Richter, F. (21 March 2023). Bank Runs: When Banks Get Caught in a Spiral of Fear [Digital image]. Retrieved 23 March 2023, from https://www.statista.com/chart/29540/bank-runs-explained/.
The Bridge
We need to pause our regularly scheduled programming to share one or two points about the nature of economies and banking in order to effectively bridge what we’re hearing with what we’re seeing.
Here at HST, we often refer to complex adaptive systems. We do so given finance and economics departments often speak of equilibrium. Finance teaches that equity markets should be efficient. Economic theory states that given enough time the supply of a product should theoretically equal the quantity demanded. Both models make for elegant charts. Both, however, fail to explain the real world. Enter the idea of the complex adaptive system. As the name would suggest, the concept does not lend itself to a simple, one-sentence definition. And for the sake of your time, our explanation hit the cutting room floor. Instead, we want to focus on one of its key characteristics: the network.
Networks are an essential ingredient in any complex adaptive system. Networks by their very nature create interdependencies. Think of a borrower who depends on a certain bank which itself depends on a customer. That customer then depends on gainful employment by a business, which may also be a borrower that depends on a different bank. In other words, no bank is an island. As the network grows, both the density and interdependency increases. As the complexity increases, the network becomes more fragile. On occasion, events occur that require the removal of what ostensibly seems to be an inconsequential link. It may not occur to anyone at the time, but removing that link inadvertently sets off a cascade of events that puts the integrity of the entire system at risk. The idea is somewhat akin to a giant game of Jenga. Remove the wrong block, a piece that for all intents and purposes looks like every other, and the entire tower collapses.
There are two key takeaways from this little sidebar. First, financial institutions are more connected than ever. They also include connections with alternative providers of credit that sit outside the walled garden of regulatory oversight and full transparency. Second, the speed at which technology has enabled society to remove a “link” in the network has accelerated from days to hours.

What We're Seeing
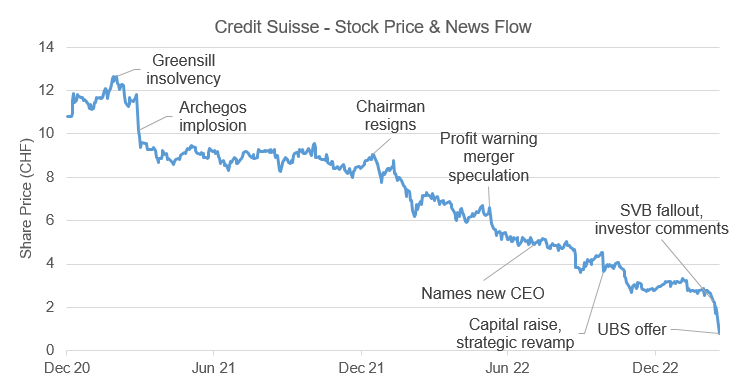
The Fed hardly had time to blink before unveiling its Bank Term Funding Program, or BTFP, that allows U.S. banks to borrow against bonds that may have lost value at 100 cents on the dollar. By permitting banks to pledge their qualifying bonds for a short-term loan, they avoid having to sell high-quality securities with paper losses in order to meet any material uptick in customer withdrawals. The current term of the facility is up to one year. It covers all federally insured depository institutions. Some were quick to question the breadth of the Fed's program given Silicon Valley Bank was arguably a unique, one-off outlier. We and others assume that most large, well-established banks have done a better job in hedging out their interest-rate risk. But any time one or two big banks come under pressure, investors start looking more closely at all financial institutions. That microscope of scrutiny quickly shifted across the Atlantic to Zurich-based Credit Suisse after its largest shareholder, Saudi National Bank, said on the 15th of March that it would not provide the bank with any further financial support. The cost to insure the bank's debt against default skyrocketed on the news. Now the issues plaguing Switzerland's second-largest bank are entirely different from those that took down SVB, but the principle remains the same. Banking is a business of confidence and Credit Suisse quickly found itself facing market-confidence issues. Similar to the Fed, Swiss regulators quickly stepped in late last week to provide a liquidity line in an effort to restore calm. The assets were sound, but confidence continued to waver. The Swiss authorities had seen enough. They brokered a deal whereby UBS agreed to buy its local rival for the equivalent of 3.3 billion CHF, the equivalent of 0.77 per share.
Source: Bloomberg. Data from 30 December 2020 to 20 March 2023.
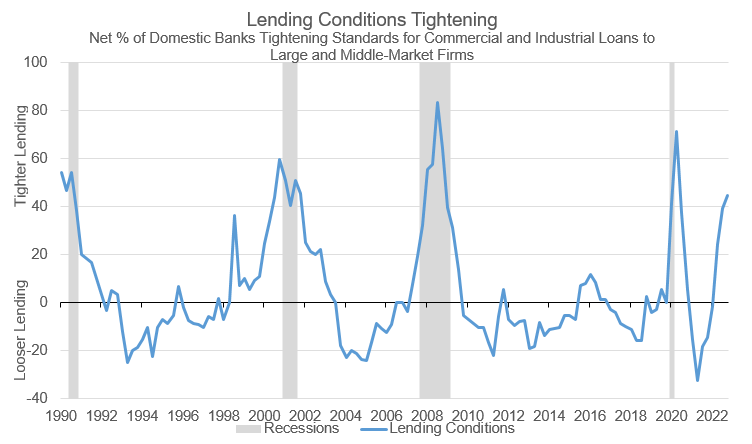
We are seeing more and more evidence that lending conditions across America began to tighten even before the events of the past two weeks unfolded. According to a Federal Reserve survey of senior loan officers who serve large and middle-market firms, bankers on balance reported tighter standards and weaker demand for commercial and industrial (C&I) loans. It is notable that no loan officer reported loosening standards. Banks can pull a few levers to reign in lending, such as raising the interest rate, reducing the size of credit lines or imposing greater requirements for collateral or loan covenants. The impact on new loan growth is fairly straightforward. What these conditions mean for moderate to highly levered businesses needing to refinance existing debt remains to be seen. For more on that we jump to the next bullet point.
Source: Federal Reserve Bank of St. Louis, The January 2023 Senior Loan Officer Opinion Survey on Bank Lending Practices.
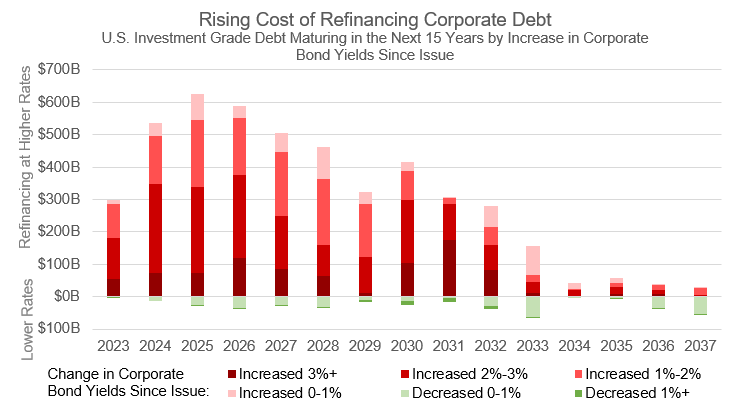
Years of ultra-low rates incentivised companies to take on meaningful amounts of debt. A majority of that debt was financed when the cost to borrow was well below what companies would pay today. U.S. investment-grade companies now have a cumulative $2.7 trillion in bonds coming due over the next five years.4 Fully repaying or refinancing that debt at a higher coupon means less money to spend in other areas. Higher rates are not the only factor a chief financial officer must monitor. Credit spreads, the difference in yield between a Treasury and a corporate bond of the same maturity, also matter given higher spreads, like higher rates, force a company to pay more. Credit spreads widen when the risk of not being repaid rises. As you can imagine, this happens during periods of economic stress. Events over the past two weeks have put upward pressure on spreads, but they remain near long-term averages. However, the data strongly suggest that the transition mechanism of monetary policy (i.e. higher rates leading lower economic output) certainly seems to be working. The question many are asking is this: will it work too well?
Source: Bloomberg. Data as of 20 March 2023.
What We're Thinking
“In economics, things take longer to happen than you think they will, and then they happen faster than you thought they could.”
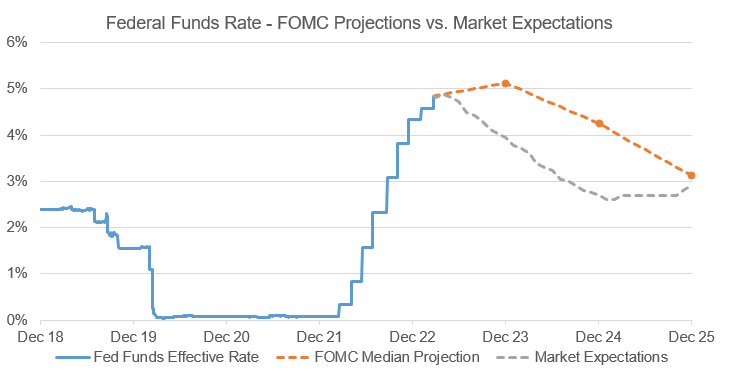
The late and distinguished German economist Rudiger “Rudi” Dornbusch uttered those words. Dornbusch is also credited with saying that none of the post-war expansions died of old age. They were all murdered by the Fed. It’s certainly become conventional wisdom in financial circles that when the Federal Reserve starts to raise interest rates, it generally keeps going until something breaks. In the span of two weeks, we’ve witnessed the second- and third-largest bank failures in U.S. history. Shortly thereafter, California-based First Republic came under extreme stress after being downgraded by all three ratings agencies, one of which cited “a high proportion of uninsured deposits” as being a contributing factor. Many estimate the impact of those bank failures to be the equivalent of a rate increase anywhere between a half and one and a half percent. Meanwhile, the U.S. Federal Reserve on Wednesday continued its war on inflation by hiking interest rates another quarter of a percent, taking the Fed funds rate to 5.0%. The Fed Chair Jerome Powell added "if we need to raise rates higher we will." Powell also said officials "just don't" see rate cuts this year but markets still think otherwise (see chart below). While the three-dimensional tug-of-war between price stability, banking stability and economic stability continues, we think the ultimate outcome remains to be anyone’s guess, but we want to leave you with a few key takeaways based on our current thinking.
- The probability of a U.S. recession is certainly higher today than it was just one month ago.
- Some sort of new banking regulation will likely rise from the ashes of Silicon Valley, Signature and Credit Suisse.
- Alternative providers of capital will likely play an even larger role in global finance going forward.
- We think it is wise to maintain a cautious approach to corporate credit in fixed-income portfolios.
- It is good to be partnered with and invested in high-quality market leaders given they typically take share in economic downturns only to come out on the other side looking even stronger.
- We believe our infrastructure assets are well positioned to deliver sound risk-adjusted returns in a variety of economic scenarios.
- We think it is prudent to remain opportunistic given above-average investment opportunities arise in pockets of distress, not periods of euphoria.
Source: Bloomberg. Data as of 23 March 2023.
Looking further ahead, if the Federal Reserve must choose between economic stability and price stability, we wonder whether a deep recession or moderate-to-high inflation is worse for a society?
Both deep recession and moderate-to-high inflation can have significant negative impacts on society, but the specific consequences may differ depending on the context. In a deep recession, economic activity slows down significantly, resulting in high levels of unemployment, reduced consumer spending, and decreased business investment. This can lead to significant financial hardship for individuals and families, and can also have broader negative effects on the economy as a whole. For example, a recession may lead to an increase in poverty rates, worsen inequality, and even cause social unrest. On the other hand, moderate-to-high inflation can also have negative consequences for society. Inflation erodes the value of money over time, meaning that consumers and businesses will need to pay more for goods and services. This can lead to reduced purchasing power, reduced savings, and may even lead to business failures. Additionally, inflation can worsen inequality, as those with lower incomes may be disproportionately affected by rising prices. In summary, both deep recessions and moderate-to-high inflation can have significant negative consequences for society. The specific impacts will depend on the context, and policymakers will need to carefully consider the trade-offs involved in addressing either issue.5
We end today’s note with a nod to ChatGPT. The artificial intelligence chatbot developed by OpenAI delivered the response to the question in the previous bullet point. Microsoft plans to embed a version of ChatGPT appropriately named Copilot inside of its flagship Office 365 software. It seeks to combine the power of large language models (LLMs) with your data in the Microsoft Graph and the Microsoft 365 apps to turn your words into the most powerful productivity tool on the planet. Perhaps the next HST will take two hours instead of two weeks to prepare. Or perhaps we may have little say in the matter. It may come down to whatever the AI overlords decide.

And until next time,
Christopher 'Kif' Hancock
Head of International Investment Solutions Group
Text Sources: 1 Data in this paragraph is sourced from SVB Financial Group Annual Reports. 2 Source: Bloomberg. 3 Data is widely reported in global media, including Bloomberg News. 4 Source: Bloomberg. 5 The content in this paragraph is sourced directly from ChatGPT in response to the question “Is a deep recession or moderate-to-high inflation worse for a society?”.
The views expressed are those of the author as of the date referenced and are subject to change at any time based on market or other conditions. These views are not intended to be and should not be relied upon as investment advice and are not intended to be a forecast of future events or a guarantee of future results. Past performance is not a guarantee of future performance and you may not get back the amount invested.
Alternative investments may be available for qualified purchasers or accredited investors only.
The information provided in this material is not intended to be and should not be considered to be a recommendation or suggestion to engage in or refrain from a particular course of action or to make or hold a particular investment or pursue a particular investment strategy, including whether or not to buy, sell, or hold any of the securities mentioned. It should not be assumed that investments in such securities have been or will be profitable. To the extent specific securities are mentioned, they have been selected by the author on an objective basis to illustrate views expressed in the commentary and do not represent all of the securities purchased, sold or recommended for advisory clients. The information contained herein has been prepared from sources believed reliable but is not guaranteed by us as to its timeliness or accuracy, and is not a complete summary or statement of all available data. This piece is intended solely for our clients and prospective clients, is for informational purposes only, and is not individually tailored for or directed to any particular client or prospective client.
Any business or tax discussion contained in this communication is not intended as a thorough, in-depth analysis of specific issues. Brown Advisory does not render legal or tax advice. Prior to making an investment decision, a prospective investor should consult with its own legal, tax, accounting and other advisors to determine the potential benefits, burdens, and other consequences of such investment.
Definitions of indices used are below. An investor cannot invest directly into an index. The S&P 500® Index represents the large-cap segment of the U.S. equity markets and consists of approximately 500 leading companies in leading industries of the U.S. economy. Criteria evaluated include market capitalization, financial viability, liquidity, public float, sector representation and corporate structure. An index constituent must also be considered a U.S. company. The S&P 500® Index is a registered trademark of Standard & Poor’s Financial Services LLC. The NASDAQ-100 Index is a modified capitalization-weighted index of the 100 largest and most active non-financial domestic and international issues listed on the NASDAQ. No security can have more than a 24% weighting. The index was developed with a base value of 125 as of February 1, 1985. Prior to December 21,1998 the Nasdaq 100 was a cap-weighted index. BLOOMBERG is a trademark/service mark of Bloomberg Finance L.P., a Delaware limited partnership, or its subsidiaries. All Rights Reserved.
