
Fast Reading
- The US large-cap equity market, particularly the Russell 1000® Growth Index and S&P 500® Index, have seen exceptional performance driven by a few mega-cap technology stocks, known as the "Magnificent Seven." This concentration has led to a skewed representation of the broader market, with these stocks significantly influencing Index performance.
- Active equity strategies have struggled to match the performance of passive strategies due to the high concentration of returns in a few stocks. Active managers typically employ more rigorous analysis and diversification strategies, which have been less effective in a market dominated by a handful of tech giants.
- The current lack of diversification in indices can present hidden risks for passive investors. While passive strategies typically offer lower fees and market performance, they may carry more risk than well-diversified active strategies, especially in a highly concentrated market.
A prolonged period of underperformance for active equity strategies versus both the market and passive strategies has prompted investors to question their value. This underperformance has been exacerbated by the increased concentration of markets, perpetuated by the attractive returns of a cohort of technology mega-caps.
Yet, defining investment success purely on performance terms can leave investors exposed to hidden and avoidable risks. The market’s high concentration of returns by just a few tech stocks exemplifies such risk and underpins the qualities beyond performance that active strategies also offer: risk mitigation through diversification, as well as the ability to provide downside protection and outperform during more turbulent market conditions.
In this article, we aim to explain the factors behind the underperformance of active equity strategies and highlight some of the less recognized consequences of recent market behavior.
Market exceptionalism
Let’s start by examining the performance of the US large-cap growth market.
In 2024, the Russell 1000 Growth Index posted a sizeable gain of 33.4%[2] and reached record highs on multiple occasions. This advance becomes even more remarkable given it was achieved immediately after a rise of 42.7%[2] in 2023. The cumulative gain of 90.3%[3] was the Index’s highest ever two-year return, although the 2019-2020 period came close (+88.9%[4]).
The exceptional performance in 2024 should also be considered over a longer time frame. For the last decade, the Russell 1000 Growth Index has delivered a compound annual growth rate of 16.8%[5](2015- 2024), this is almost double the annualized returns of the previous decade (2005-2014) at 8.5%[6].
The Index has posted a positive return in all but two of the last 16 years. This performance should be deemed even more exceptional given it has been achieved against a backdrop of shifting macroeconomic cycles and heightened volatility, where investors have been forced to grapple with a global pandemic, as well as ongoing geopolitical realignment.
Amid this market euphoria, it would be easy to assume that all US stocks have reached meteoric levels. Yet, when you drill down beyond the headlines you find that, in actuality, these gains have been driven by just a handful of stocks.
The group of tech-orientated stocks known as the Magnificent Seven (Mag 7) posted outsized gains again in 2024. As shown in Figure 1, these stocks – bar Microsoft (12.1%) and Apple (30.1%) – outperformed the wider market, with NVIDIA rallying 171.2%!
Moreover, during the last three years (as of 12/31/2024), 72% of the Russell 1000 Growth Index’s return came from Mag 7 stocks, highlighting the impact this small group of stocks has had on the overall Index[7].
A large part of these gains was driven by the excitement surrounding the potential for artificial intelligence (AI), with the world’s biggest technology companies investing heavily in this emerging technology, while chipmaker NVIDIA saw its earnings rapidly multiply as AI relies heavily on its advanced semiconductors.
A flawed market
The dominance of the mega-cap stocks underlines the first reason why active equity strategies have been unable to match the performance of ‘the market’ in recent years. It is easy to forget that when investors refer to ‘the market’ they are really referencing specific market indices – for US large-cap growth the most representative index is the Russell 1000 Growth Index and for US large-cap core it is S&P 500 Index. These indices don’t actually represent ‘the market’, but are investment products created by companies such as MSCI, S&P and FTSE Russell, etc.
FIG 1: PERFORMANCE OF MAGNEIFICENT SEVEN STOCKS IN 2024
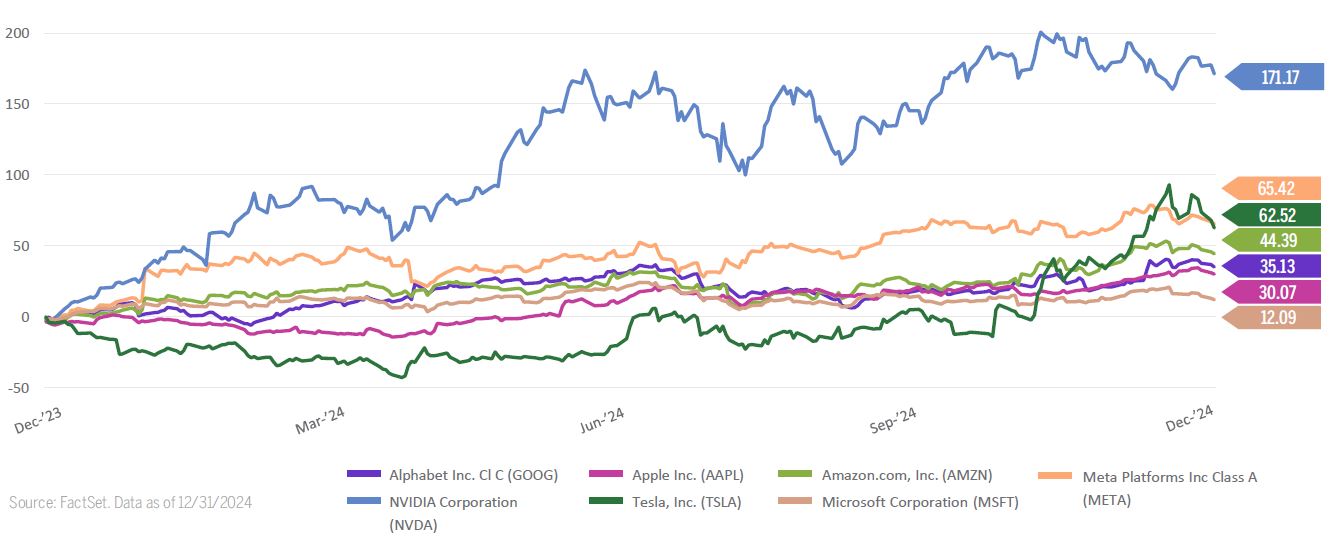
Source: FactSet. Data as of 12/31/2024
Indices serve as a representative subset of a specific market – i.e. US large-cap growth – by selecting a sample of relevant companies as defined by the index provider’s particular methodology. Here’s where the quality of indices can differ – as some providers have less rigorous index construction approaches than others, which can have a knock-on effect on the robustness of the index.
For example, FTSE Russell uses just three factors to determine whether or not a company meets the criteria for its Russell 1000 Growth Index; it analyses book-to-price, I/B/E/S** forecast medium-term growth and historical sales per share growth to ascertain whether a company conforms to its investment universe requirements. Compare this to the rigor of analysis typically conducted by an active manager, where researchers may scrutinize more than one hundred data points for any prospective holdings.
In January 2025, FTSE Russell announced a proposal to shift to a semiannual reconstitution frequency of the Russell U.S. Indexes in 2026 to ensure its constituents continue to reflect the appropriate characteristics. Again, this fares unfavorably with an active investment strategy where portfolio composition is reviewed far more regularly.
While FTSE Russell intends for its methodology to produce a ‘comprehensive and unbiased barometer for the large-cap growth segment’, recent years have shown this process to be flawed.
Like many other indices, the Russell 1000 Growth Index applies a ‘market cap-weighted’ approach, which means each index component is weighted relative to its total market capitalization. Historically, this has not been a concern, but the substantial rise in the market capitalization of key technology companies has generated high levels of concentration, which limit the Index’s ability to be a genuine representation of the broader market.
Collectively, these mega-caps represent an increasingly large share of the Index. At the end of December 2024, the Russell 1000 Growth Index's top ten constituents amounted to 61.33% of the total Index see Figure 2. Most of these comprise Mag 7 companies – with Alphabet taking two spots. The S&P 500 Index benefits from far less concentration in the top ten but these companies still account for over 37% of the portfolio- well above the 27% share reached at the peak of the tech bubble in 2000[8]. While not all of the Mag 7 companies are formally designated as being part of the technology industry, they are certainly technology-adjacent, which leaves just one company in tenth place from a non-technology industry.
FIG 2: RUSSELL 1000 GROWTH INDEX TOP TEN CONSTITUENTS
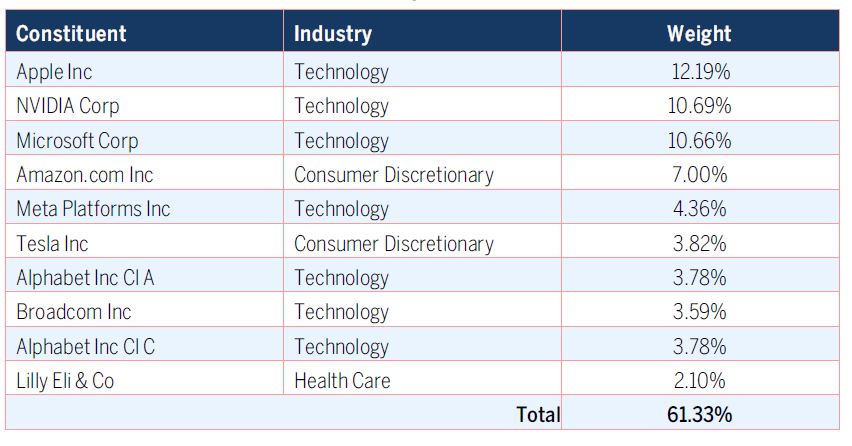
Source: FTSE Russell. Data as of 12/31/2024. Industries are based on the ICB Classification system.
FIG 3: S&P 500 Index Top Ten Constituents
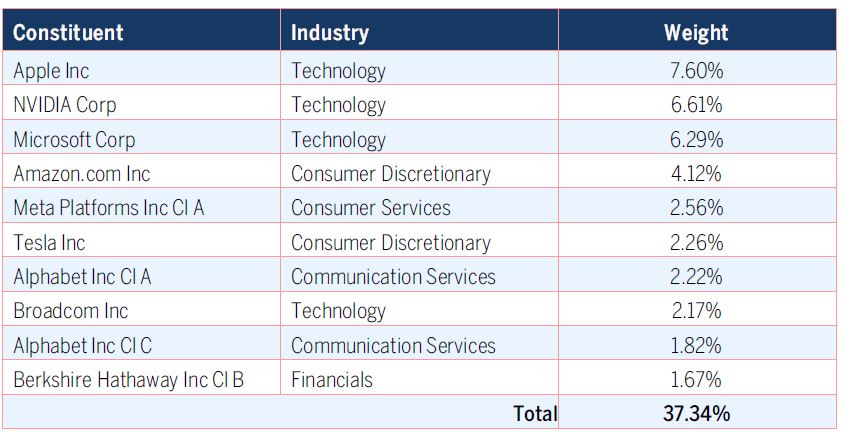
Source: FactSet. Data as of 12/31/2024. Sectors are based on the Global Industry Classification Standard (GICS®) classification system.
FIG 4: Russell 1000 Growth Index Concentration (03/31/1988-12/31/2024)
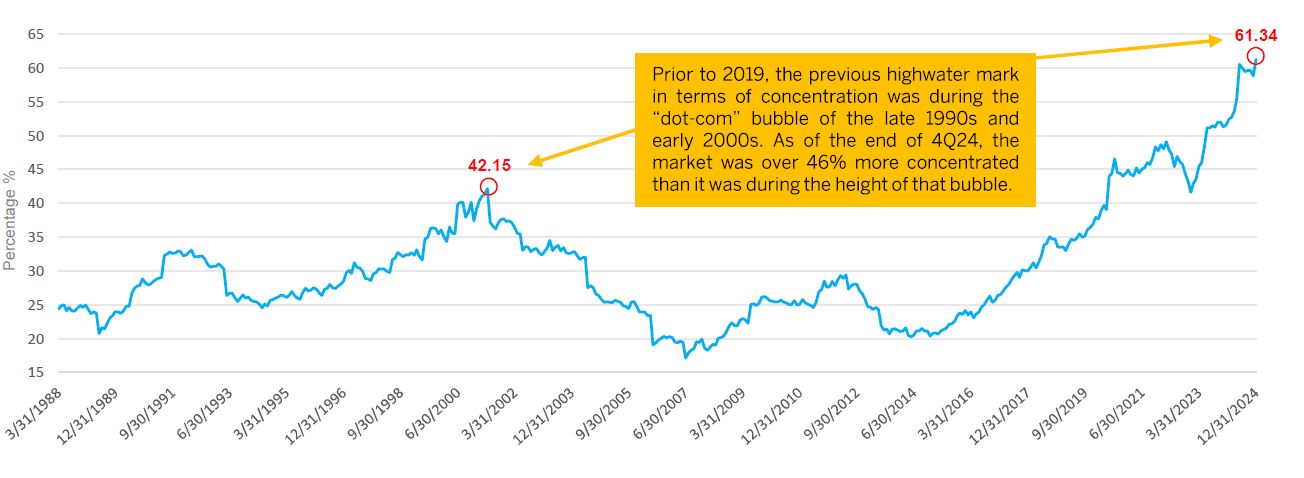
Source: FactSet.
Figure 4 tracks the dramatic rise in the level of concentration of the top ten companies over the past five years. Its current concentration level of 61+% is significantly higher than the previous high watermark of 42.2% during the dot.com bubble in the late 1990s and early 2000s. The consequence of such unprecedented levels of Index concentration is that fewer stocks influence market direction. In 2024, just 20% of Index constituents outperformed the Index, see Figure 5.
FIG 5: % Of Outperforming Individual Stocks in the Russell 1000 Growth Index
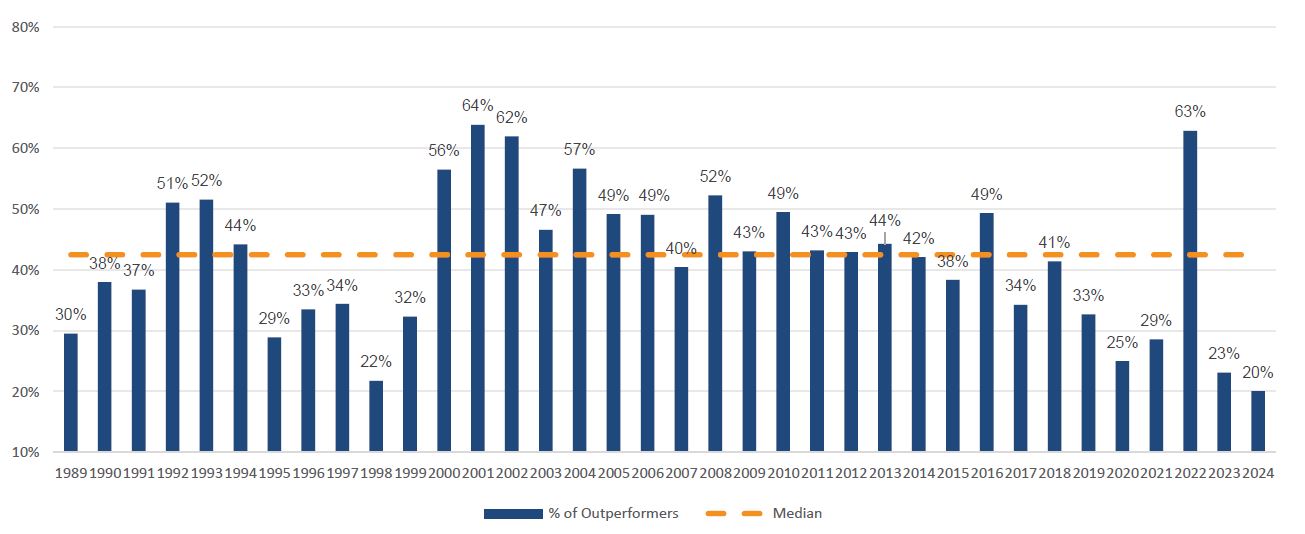
Source: FactSet. Data as of 12/31/2024
This rise in market concentration is starting to ring alarm bells among index providers. In November 2024, FTSE Russell quietly announced plans to tackle index concentration by subtly altering its methodology. From March 21, 2025, the combination of companies with a weight greater than 4.5% cannot make up more than 45% of the Russell 1000 Growth Index, and no individual company in the Index can have a weight greater than 22.5% of the Index.
Susceptibility to momentum
Investors should be alert to this rare shift in how FTSE Russell constructs its indices as it highlights that such unprecedented levels of index concentration present several investment risks.
Continuing to use the Russell 1000 Growth Index as our example, as of December 31, 2024, out of the 396[9] companies within the Index we have already shown that only a handful determine its direction. That these companies are almost uniformly connected to a single sector – technology – suggests the Index’s return drivers have become increasingly narrow and highlights that the Index has an embedded sector drift.
In this instance, momentum is being driven by the transformative potential of artificial intelligence, the spending power of the technology giants to harness this technology and the realized earnings of those companies providing vital components. However, the Index could be equally susceptible to other momentum drivers, for example, a shift to more defensive or value-oriented companies.
The key point for investors to absorb is that high concentration is eroding the diversification attributes of indices. For example, as shown in Figure 6, at the end of December 2024, almost 60% of the Russell 1000 Growth Index was exposed to the technology sector, with another near 20% being represented by the consumer discretionary sector (which includes tech-adjacent companies such as Amazon and Tesla), leaving a mere 20% for all the rest of the Index’s investment universe. These high sector exposures are more commensurate with a thematic index such as the Nasdaq Index than one purporting to deliver diversified market exposure.
FIG 6: Industry breakdown of the Russell 1000 Growth Index
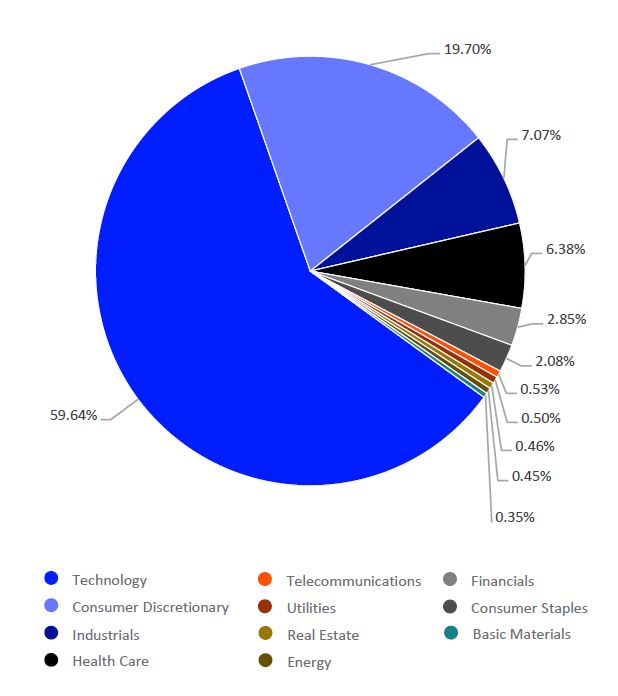
Source: FTSE Russell. Data as of 12/31/2024. Industries are based on the ICB Sector Classification system.
Diversification constraints
Given one of the key principles of investing concerns diversifying risk, most active strategies (unless they have a specific thematic focus) are – to a certain extent – constructed around the idea of diversifying sector exposure.
For active strategies, diversification doesn’t necessarily mean conforming to the benchmark as per the remit of passive strategies. They take active positions where they tactically overweight or underweight, or even omit, certain sectors that are expected to either out or underperform (respectively), while still maintaining diversification. Such active positioning means they can likely outperform during down as well as up markets. A strategy’s differentiation from the benchmark can be measured by an active share calculation (a measurement of how different a strategy's holdings are from its benchmark index).
With index diversification becoming narrower, as illustrated in Figure 6, active strategies that mirror this trend (i.e. they reduce their diversification in favor of increasing their exposure to the outperforming stocks) may see their active share fall from a level of around 70 – which indicates a high level of active management – to below 50 which suggests the strategy is more closely replicating the index or a ‘closet index tracker’. For investors that have opted for an active rather than a passive strategy, such a fall in the active share should be construed as a failure to adhere to the strategy’s ‘active’ objective.
While many active strategies purport to be unconstrained when it comes to their relative benchmark positioning, they often employ constraints to ensure diversification. For example, size limits on individual stocks can provide risk management at a security level and also lead to a more diversified portfolio that reduces overall portfoliolevel risk.
Right now, the use of such position limits mean that it is almost impossible for active strategies to mirror the size of the benchmark index’s exposure to the mega-caps, with the result that they have been unable to keep up with index returns when these stocks outperform.
With indices becoming so concentrated and narrow, the notion that they are a fair measure of performance for an investment strategy is also proving to be unreliable. How can an investment strategy that balances its portfolio across a broad number of economic and sectoral drivers be fairly measured against a benchmark which is no longer sufficiently diversified?
This begs the question of whether active managers are using the correct indices with which to benchmark their relative performance. While the simple answer should be to change benchmarks, things are not that straightforward. Although there is a growing recognition that certain indices may be imperfect, applicable alternatives are lacking. Furthermore, the optics of switching benchmarks – no matter the reasons – can smack of cherry-picking and tend to be avoided. This means periods of performance dislocation from benchmarks – both positive and negative – are to be expected.
Avoiding hidden risks
Changing market dynamics also mean that passive investors may unwittingly be exposed to greater levels of risk. This is particularly important as the underperformance of so many diversified, active strategies has naturally steered more investors towards passives. According to data from research group ETFGI, investors poured USD 1.7tn into ETFs in 2024, pushing the industry’s total assets up 30 per cent to USD 15tn[10].
Passive strategies are designed to mimic their respective index and deliver pure beta – i.e. market performance. The pay-off for their inability to capture alpha – i.e. to beat the market – is a much lower fee structure than those typically charged by active managers, which have the potential to outperform.
Many investors turn to passive strategies in the belief that ‘buying the market’ is a less risky way of investing due to its natural diversification. However, as we have shown that is simply not the case right now. The concentration and narrow return drivers of indices, such as the Russell 1000 Growth Index and S&P 500 Index, mean that investing in their representative passive investments inherently has more risk than investing in a concentrated, active strategy.
Another rationale for investing via a passive rather than an active strategy is the perception that you are investing in the whole index – for example, c.400 stocks – rather than a more concentrated, active strategy that may only hold between 30 and 50 positions. However, as we have already highlighted, index performance is currently concentrated among just a few companies, thereby again eroding any notion of diversification.
Finally, by replicating the market, a passive strategy will always move in the same direction as the market. While that may be attractive during periods of positive market performance, the same cannot be said of during market declines where passive strategies offer no downside protection whatsoever.
In our view, passive investors need to be made more aware that the current lack of index diversification presents a ‘hidden’ risk, as buying an index could actually be riskier than investing in a concentrated, active manager over the longer term.
Echoes of the dot.com bubble
So why should investors be concerned about concentration risk and a lack of diversification if their strategies are performing well?
As alluded to earlier, market momentum in recent years has predominantly been driven by one primary source – technology and the transformative potential of artificial intelligence via the Mag 7 stocks. While we have few concerns about the stability and future viability of these prosperous and well-managed companies, the momentous growth of their market capitalization does provoke questions about their current valuations and the potential to sustain these growth rates going forward.
At Brown Advisory, our experience of managing US equities goes back to the mid-1990s and we recognize concentration issues in today’s market that were also evident in the years of the dot.com bubble in early 2000. The longevity of our equity capability means we have navigated this type of concentrated market environment in the past and can, therefore, use these learnings to inform our strategy now.
Firstly, while there are certainly echoes of the dot.com bubble in terms of today’s high valuations, there are also significant differences. Foremost, is that the technology bubble came to an end alongside an economic downturn. While 2025 forecasts continue to suggest the worldwide economy is strengthening, geopolitical, political and fiscal uncertainties are generating concern about economic growth, particularly in the US, which has resulted in some stock market volatility and steep declines for the Mag 7 stocks, in particular.
FIG 7: Active Large Blend Out/Underperformance vs. Passive
Active Large Blend generally outperformed Passive over the period from 2000 to 2013
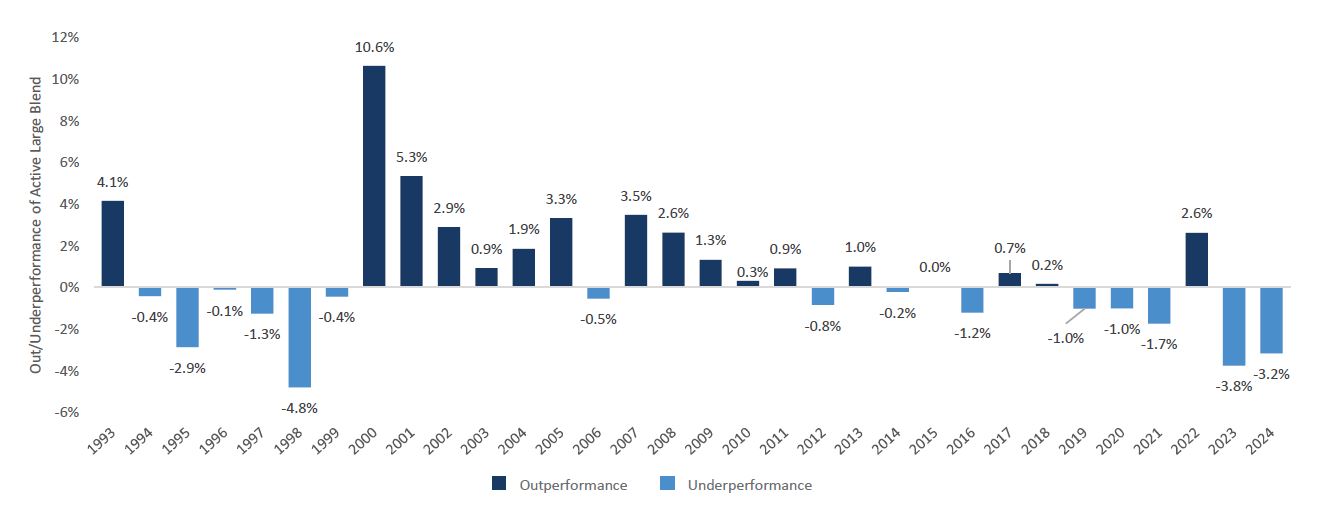
Source: eVestment and Bloomberg for period 1993-2024. Active Large Blend is made up of current funds from the eVestment Large Blend category that are not index or enhanced index funds. Passive benchmark comparison is represented by S&P 500 ETF. The eVestment U.S. Large-Cap Blend universe classification (“universe”) includes U.S. equity strategies that invest primarily in large capitalization stocks with a mix of growth and value characteristics. These portfolios typically represent the overall U.S. stock market in terms of size, growth rates, and price.
We are certainly not advocating that the reign of the Mag 7 will soon come to an end. However, we are now seeing some stock market rotation and broadening of returns, and believe that opportunities to capture alpha could be better accessed by actively diversifying beyond this group.
Which brings us back to the dot.com bubble. At that time, many active managers similarly struggled to keep up with the benchmark as technology companies soared and market concentration levels rose. However, once that bubble burst, many active strategies rapidly recovered their underperformance, and the following decade proved to be one of the best periods of outperformance for active managers, as shown in Figure 7.
Quite simply, active managers are typically able to take advantage of information asymmetry to benefit from periods of market dislocation. In effect, they can generally find more opportunities when markets are inefficient because strong upward, or downward, momentum can result in stocks becoming misvalued and no longer reflecting business fundamentals as the key driver of long-term performance. That said, it’s important not to lean entirely on informational asymmetry because it’s difficult to find an informational edge on a large-cap company. By also factoring in the concept of time arbitrage – investing for the long-term and taking advantage of near-term price dislocations (in other words, seeing through the noise) – active managers can emphasize their long-term investment horizon and ability to navigate short-term market fluctuations.
This matters because even though active managers have struggled to keep up with the market in recent times, history has shown that active managers can identify these inefficiencies and take advantage once normal market functionality resumes. This reflects the theory of mean reversion, that while there are often periods of market distortion, stock prices will eventually reflect the ‘fair’ value of a company.
For active managers, the price they pay for a stock matters – they want to select undervalued stocks and avoid those they consider to be overvalued in order to maximize returns over the long term.
Staying true to your principles
These episodes of underperformance are often followed by high levels of alpha generation which is no surprise to us at Brown Advisory.
Across all of our investment strategies, our philosophy is based on the view that to outperform and generate alpha over the long term, we need to differentiate our strategies from their benchmarks. That it is better to invest in the best companies rather than owning a piece of them all.
In practice this means we don’t just chase the latest fad or market darling; instead, we focus on investing in companies that we believe will sustain long-term above average-growth or that look likely to grow in value over time. This certainly doesn’t preclude ownership of some of the largest names in our benchmarks, and we do, but we tend to find that there are many other opportunities including companies that are smaller in size that are superior in growth and uniqueness.
Therefore, to us, periods of underperformance are simply the byproduct of well-diversified but concentrated portfolios that are focused on long-term performance. We do not believe there is anything unusual about this periodic underperformance, nor the likelihood of future outperformance. It is a cycle we have experienced before and will likely do so again and again. That said, we are sensitive to client concerns about extended underperformance and often review our tactic of not fighting the tide. Our embedded culture of continuous improvement prompts us to regularly consider how we can best sharpen our investment process. For example, over the last ten years, we have employed behavioral analysis to systematically improve skills and avoid bias pitfalls. Yet, despite this pledge to continue observing, learning and enhancing, our response to this question is that we believe it is best to retain and preserve the investment characteristics that our clients hired us to provide.
If our portfolios exhibited the type of style drift that we have observed in our benchmark, then our clients would rightly be concerned that we no longer embody these objectives. We find that being fully transparent with our clients about what our strategies are designed to do means they are less likely to be surprised by underperformance in a market environment that is unfavorable to our style.
Be positioned to harness broader market dynamics
Our clients look to us to provide highly active, risk-managed and diversified portfolios – an approach that is unsuited to the narrow, concentrated returns we have seen in recent years. But, in our view, it is an approach that is well-positioned to take advantage of the inevitable changes to that market dynamic. We have already seen episodes of outperformance during the market’s periodic volatility episodes, when returns have immediately broadened out beyond the Mag 7.
In fact, active managers haven’t necessarily needed all of the Mag 7 to trade lower in order to outperform. It is the collective strength of the Mag 7 that has proven challenging. If this group of stocks faces more episodes of idiosyncratic volatility – as has already been seen in Q1 2025 amid the market’s reaction to the emergence of the Chinese artificial intelligence company DeepSeek and wider concerns about the US economy – there should be more opportunities for active strategies to perform, be this through the capture of alpha or by offering greater downside protection. This period has also exposed the risks being unwittingly taken by passive investors, as these strategies offer no shelter against negative changes in market sentiment and direction.
And as we progress through 2025, we anticipate that less certain expectations around central banks’ interest rate cutting pathways, lingering inflation concerns, and volatility connected to the Trump administration’s economic policy will create further reasons for markets to broaden their focus. We believe this environment should provide a greater opportunity set to enable proven, diversified active strategies – such as our own – to outperform once more.
1. Source: Morningstar
2. Source: Morningstar 3. Source: Morningstar 4. Source: Morningstar 5. Source: Morningstar 6. Source: Morningstar 7. Source: FactSet as of 12/31/2024 8. Source: https://www.goldmansachs.com/insights/articles/is-the-sp-too-concentrat… -
9. Source: https://www.lseg.com/en/ftse-russell/index-resources/factsheets
10. Source: https://www.ft.com/content/e23897c4-0d9d-4b6a-9c43-590870e4eb5e
Please note that this article was revised as of 04/03/2025 to include a broader focus on large-cap equities. A prior version’s emphasis was on large-cap growth equities.
Magnificent Seven (Mag 7) stocks: Alphabet, Amazon, Apple, Meta, Microsoft, NVIDIA, and Tesla.
Disclosures
The views expressed are those of the author and Brown Advisory as of the date referenced and are subject to change at any time based on market or other conditions. These views are not intended to be and should not be relied upon as investment advice and are not intended to be a forecast of future events or a guarantee of future results. Past performance is not a guarantee of future performance and you may not get back the amount invested.
The information provided in this material is not intended to be and should not be considered to be a recommendation or suggestion to engage in or refrain from a particular course of action or to make or hold a particular investment or pursue a particular investment strategy, including whether or not to buy, sell, or hold any of the securities or issuers mentioned. It should not be assumed that investments in such securities or issuers have been or will be profitable. References to specific securities or issuers are to illustrate views expressed in the commentary and do not represent all of the securities purchased, sold or recommended for advisory clients. The information contained herein has been prepared from sources believed reliable but is not guaranteed by us as to its timeliness or accuracy and is not a complete summary or statement of all available data.
©2025 Morningstar, Inc. All Rights Reserved. The information contained herein: (1) is proprietary to Morningstar and/or its content providers; (2) may not be copied or distributed; and (3) is not warranted to be accurate, complete or timely. Neither Morningstar nor its content providers are responsible for any damages or losses arising from any use of this information.
The Nasdaq Index is a stock market index that includes almost all stocks listed on the Nasdaq stock exchange.
The S&P 500 Index is a capitalization-weighted index of 500 stocks that is designed to measure performance of the broad domestic economy through changes in the aggregate market value of 500 stocks representing all major industries. Index returns assume reinvestment of dividends and do not reflect any fees or expenses. An investor cannot invest directly into an index. Benchmark returns are not covered by the report of the independent verifiers. Standard & Poor’s, S&P®, and S&P 500® are registered trademarks of Standard & Poor’s Financial Services LLC (“S&P”), a subsidiary of S&P Global Inc.
The Russell 1000® Growth Index measures the performance of the large-cap growth segment of the U.S. equity universe. It includes those Russell 1000® Index companies with higher price-to-book ratios and higher forecasted growth values. The Russell 1000® Growth Index is constructed to provide a comprehensive and unbiased barometer for the large-cap growth segment. The Index is completely reconstituted annually to ensure that new and growing equities are included and that the represented companies continue to reflect growth characteristics. Russell® and other service marks and trademarks related to the Russell indexes are trademarks of the London Stock Exchange Group Companies. An investor cannot invest directly into an index.
Frank Russell Company (“Russell”) is the source and owner of the trademarks, service marks and copyrights related to the Russell Indexes. Russell® is a trademark of Frank Russell Company. Neither Russell nor its licensors accept any liability for any errors or omissions in the Russell Indexes and / or Russell ratings or underlying data and no party may rely on any Russell Indexes and / or Russell ratings and / or underlying data contained in this communication. No further distribution of Russell Data is permitted without Russell’s express written consent. Russell does not promote, sponsor or endorse the content of this communication.
FactSet® is a registered trademark of FactSet Research Systems, Inc.
Global Industry Classification Standard (GICS®) and “GICS” are service makers/trademarks of MSCI and Standard & Poor’s. FactSet ® is a registered trademark of FactSet Research Systems, Inc. APX® is a trademark of Advent Software Systems.
©2025 London Stock Exchange Group plc and its applicable group undertakings (“LSEG”). LSEG includes (1) FTSE International Limited (“FTSE”), (2) Frank Russell Company (“Russell”), (3) FTSE Global Debt Capital Markets Inc. and FTSE Global Debt Capital Markets Limited (together, “FTSE Canada”), (4) FTSE Fixed Income Europe Limited (“FTSE FI Europe”), (5) FTSE Fixed Income LLC (“FTSE FI”), (6) FTSE (Beijing) Consulting Limited (“WOFE”) (7) Refinitiv Benchmark Services (UK) Limited (“RBSL”), (8) Refinitiv Limited (“RL”) and (9) Beyond Ratings S.A.S. (“BR”). All rights reserved. FTSE Russell® is a trading name of FTSE, Russell, FTSE Canada, FTSE FI, FTSE FI Europe, WOFE, RBSL, RL, and BR. “FTSE®” “Russell®”, “FTSE Russell®”, “FTSE4Good®”, “ICB®”, “Refinitiv”, “Beyond Ratings®”, “WMRTM”, “FRTM” and all other trademarks and service marks used herein (whether registered or unregistered) are trademarks and/or service marks owned or licensed by the applicable member of LSEG or their respective licensors and are owned, or used under license, by FTSE, Russell, FTSE Canada, FTSE FI, FTSE FI Europe, WOFE, RBSL, RL or BR. FTSE International Limited is authorized and regulated by the Financial Conduct Authority as a benchmark administrator. Refinitiv Benchmark Services (UK) Limited is authorized and regulated by the Financial Conduct Authority as a benchmark administrator.
Terms & Definitions
Compound Annual Growth Rate (CAGR) is the rate of return that would be required for an investment to grow from its beginning balance to its ending balance, assuming the profits were reinvested at the end of each period of the investment’s life span. Book/Price (B/P) ratio measures the market’s valuation of a company relative to its book value. The Institutional Brokers' Estimate System (I/B/E/S) is a database used by brokers and active investors to access the estimates made by stock analysts regarding the future earnings of publicly traded American companies. Market Capitalization is the value of the fund as determined by the market price of its issued and outstanding stock. Beta is a measure of a stock's volatility or systematic risk compared to the overall market. Active Share is calculated by taking the sum of the absolute value of the differences of the weight of each holding in the manager's portfolio versus the weight of each holding in the benchmark index and dividing by two. Alpha is a measure of performance on a risk-adjusted basis. Alpha takes the volatility (price risk) of a portfolio and compares its risk-adjusted performance toa benchmark index. Sales per share growth measures the increase in a company's revenue per share over a specific period, such as quarterly, annually, or trailing twelve months (TTM). It is calculated by comparing the sales per share at the beginning and end of the period. Downside protection refers to strategies and techniques used to mitigate or prevent a decrease in the value of an investment. S&P 500 ETF (Exchange-Traded Fund) is a type of investment fund that aims to replicate the performance of the S&P 500 Index, which includes 500 of the largest publicly traded companies in the U.S. These ETFs hold a portfolio of stocks that mirrors the composition of the S&P 500 Index.