I once asked a bond manager if he had ever held a bond that went into default. Without missing a beat, he replied, “That’s entirely the wrong question. What you should ask me is whether I’ve ever sold a bond at less than 50 cents on the dollar.”
He was absolutely right. I had asked about technical default, and he reminded me that the risk event I sought to identify (i.e., price collapse) takes place when the market perceives the “chance” of default. The lesson was clear: You need to know your subject, but more importantly, you need to ask the right questions.
To that end, we wanted to pose a few questions about European small-cap stocks, and in the process shed some light on how our team evaluates investment managers in general. European small caps are an opportunity that many overlook—but by posing what we consider to be the right questions, we have found plenty to like in this space.
The Right Reasons
When we look at investment managers, one of the first questions we ask is whether the manager is in “the investment business,” or in “the business of investing.” In other words, does profit motive unduly influence a manager to deliver management fees for the firm at the expense of generating investment returns for the client? Unfortunately, our experience suggests that too many managers are more focused on the former at the expense of the latter. Perhaps this is one reason there are so few European small-cap equity strategies in the market today.
Morningstar identifies 76 active European small-cap funds in the U.S. with at least a five-year track record; by comparison, there are hundreds of active U.S. small-cap mutual fund offerings with similar longevity.
Why the difference?
For one, the discrepancy seems reasonable given that America’s small-cap universe generally offers managers greater latitude and depth than Europe’s does. The table below shows that America’s benchmark is twice the size of Europe’s when measured by index constituents and cumulative market capitalization. This size discrepancy directly translates into more restrictive capacity limits on European strategies. Less capacity often means less revenue. And since less revenue is seldom offset by lower expenses in the investment industry, the business case for dedicated small-cap strategies in Europe is not as strong.
European Small Cap Opportunity is Half That of the U.S. in Terms of Size
Source: Bloomberg, as of 3/31/2019
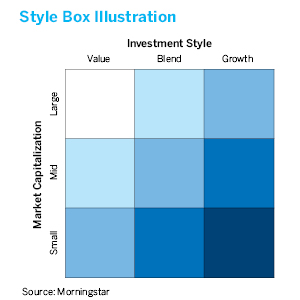
Moreover, in our experience, U.S. firms are more predisposed to create “style box” strategies that hew to a defined market-cap range and style, whilst European firms often ignore such defined designations and instead lean towards all-cap strategies that traverse the market-cap spectrum. (The diagram below illustrates the style-box concept; while many U.S. strategies focus on one of these boxes—e.g. large growth, or small value—European strategies more often seek to cover multiple boxes or the entire square.) The economic incentives of this “all-in-one” approach typically leave less room for smaller companies to have a meaningful impact.
 All well and good. But perhaps the real question we need to ask is whether European small caps merit a distinct and meaningful allocation in client portfolios.
We argue that they do.
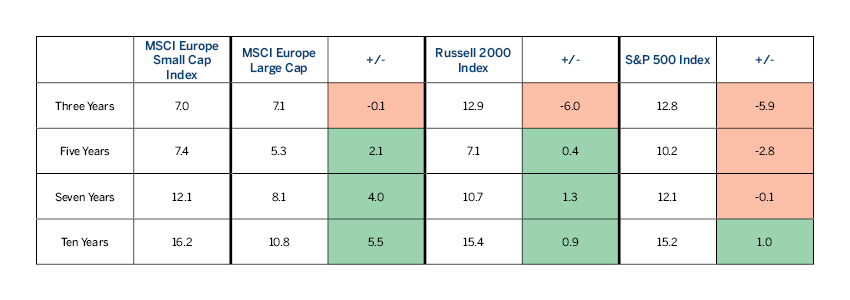
The table below shows annualized returns of European small-cap and large-cap indexes, as well as their U.S. counterparts on a constant-currency basis. First, it’s worth highlighting that European small-caps have outperformed their U.S. peers on the trailing five-, seven- and ten-year periods despite a decade in which U.S. economic growth far surpassed European growth. Second, whilst the excess return over U.S. indices is noteworthy, we view the sizable spread between European large and small-cap stocks as more important. It suggests that, for many firms, the “business” case of managing a sizable large-cap fund may be outweighing the “investment” case of managing a capacity-constrained small-cap fund that delivers sizable performance.
Absolute and Relative Annualized Returns as of 3/31/2019
European small caps have outpaced U.S. small caps and European large-caps over longer time periods.
Source: Bloomberg
Opportunities for Active Managers
Once we determine if an asset class merits a targeted allocation, we need to ask whether it is feasible to enhance those returns via active management.
We argue that it is.
In our view, the European small-cap market is quite inefficient in terms of information flow. Small-cap companies globally have typically received less research attention than their large-cap counterparts. The structural large-cap bias in European equity portfolios and the recent implementation of MiFID II—and its impact of reducing the number of sell-side analysts—only enhances that inefficiency.
We have partnered with two European small-cap managers in recent years, and their long-term performance demonstrates the potential to generate alpha within the asset class. Excess returns generated by both managers, on both an absolute and a risk-adjusted basis, have been meaningful and consistent.
The challenge, however, is finding enough capacity to satisfy client demand. The management teams of both managers mentioned above held true to their word, and closed to new investors when assets reached stated capacity limits. In other words, both managers are in the “business of investing.”
So our search for the next alpha-generating management firm continues. Like our European partners, we too are in the business of investing. Meaning, we will not simply select active managers for active management’s sake. It’s all about asking the right questions. 
The views expressed are those of Brown Advisory as of the date referenced and are subject to change at any time based on market or other conditions. These views are not intended to be and should not be relied upon as investment advice and are not intended to be a forecast of future events or a guarantee of future results. Past performance is not a guarantee of future performance and you may not get back the amount invested.
The information provided in this material is not intended to be and should not be considered to be a recommendation or suggestion to engage in or refrain from a particular course of action or to make or hold a particular investment or pursue a particular investment strategy, including whether or not to buy, sell, or hold any of the securities mentioned. It should not be assumed that investments in such securities have been or will be profitable. To the extent specific securities are mentioned, they have been selected by the author on an objective basis to illustrate views expressed in the commentary and do not represent all of the securities purchased, sold or recommended for advisory clients. The information contained herein has been prepared from sources believed reliable but is not guaranteed by us as to its timeliness or accuracy, and is not a complete summary or statement of all available data. This piece is intended solely for our clients and prospective clients, is for informational purposes only, and is not individually tailored for or directed to any particular client or prospective client.
The S&P 500® Index represents the large-cap segment of the U.S. equity markets and consists of approximately 500 leading companies in leading industries of the U.S. economy. Criteria evaluated include: market capitalization, financial viability, liquidity, public float, sector representation, and corporate structure. An index constituent must also be considered a U.S. company. Standard & Poor’s, S&P, and S&P 500 are registered trademarks of Standard & Poor’s Financial Services LLC (“S&P”), a subsidiary of S&P Global Inc. The Russell 2000® Index is a market-capitalization weighted equity index that provides exposure to the small-capitalization segment of the U.S. stock market. It tracks the performance of the 2,000 smallest companies (as measured by market cap) in the Russell 3000® Index (a broad-market index that represents about 98% of all U.S. incorporated equity securities). The Russell 2000® Index, Russell 3000® Index and Russell® are trademarks/service marks of the London Stock Exchange Group of companies. The MSCI Europe Large Cap Index is designed to represent the performance of large-cap equities across 15 developed markets. As of March 2019 it had more than 190 constituents and covered approximately 70% of the free float-adjusted market capitalization across the European developed-market equity universe. The MSCI Europe Small Cap Index is designed to represent the performance of large-cap equities across 15 developed markets. As of March 2019 it had more than 990 constituents and covered approximately 14% of the free float-adjusted market capitalization across the European developed-market equity universe. All MSCI indexes and products are trademarks and service marks of MSCI or its subsidiaries. Investors cannot invest directly in an index.
BLOOMBERG is a trademark and service mark of Bloomberg Finance L.P., a Delaware limited partnership, or its subsidiaries.
© 2019 Morningstar, Inc. All rights reserved. The information contained herein related to style boxes: (1) is proprietary to Morningstar and/or its content providers; (2) may not be copied or distributed; and (3) is not warranted to be accurate, complete, or timely. Neither Morningstar nor its content providers are responsible for any damages or losses arising from any use of this information. Past performance is no guarantee of future results.


